
PUBLISHER: Mordor Intelligence | PRODUCT CODE: 2062018

PUBLISHER: Mordor Intelligence | PRODUCT CODE: 2062018
Sodium Benzoate - Market Share Analysis, Industry Trends & Statistics, Growth Forecasts (2026 - 2031)
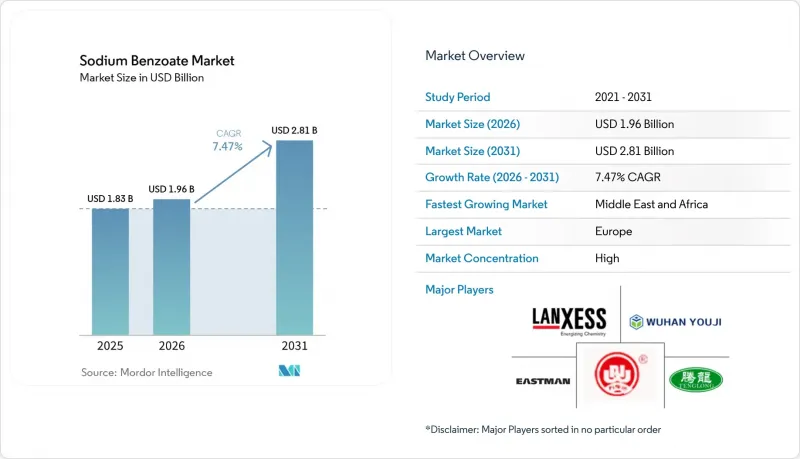
According to Mordor Intelligence, the sodium benzoate market size was valued at USD 1.83 billion in 2025 and is estimated to grow from USD 1.96 billion in 2026 to reach USD 2.81 billion by 2031, at a CAGR of 7.47% during the forecast period (2026-2031).
This report is Segmented by Application (Food and Beverages, Pharmaceuticals, Personal Care and Cosmetics, and Industrial), Grade (Food Grade, Pharmaceutical Grade, and Industrial Grade), Form (Powder/Granules and Liquid), and Geography (Asia-Pacific, North America, Europe, South America, Middle East and Africa). The Market Forecasts are Provided in Terms of Value (USD).
Global Sodium Benzoate Market Trends and Insights
Food and Beverage Preservative Demand Surge
Roughly 52% of global food-application volume flows into carbonated drinks, juices, and acidic condiments, where sodium benzoate is used up to 0.1% for reliable inhibition below pH 4.5. The U.S. FDA continues to list the preservative as GRAS, reinforcing confidence in emerging markets that benchmark American regulations. Cost-sensitive bottlers in India, Nigeria, and Indonesia prefer sodium benzoate because it remains 20-30% cheaper than potassium sorbate on a molar basis. A 2025 survey of beverages in Sulaymaniyah, Iraq, found mean concentrations of 84.10 mg/L, well inside Codex limits, confirming safety margins under real-world conditions. These economics and compliance buffers offset clean-label erosion in premium Western brands.
Shift Toward Processed Foods in APAC and Africa
India's packaged-food sector is projected to rise from INR 10,180 billion (USD 122 billion) in fiscal 2024 to INR 17,120 billion (USD 206 billion) by fiscal 2029 at an 11% CAGR, with ready-to-eat meals expanding 16% annually. Urbanization and growing e-commerce penetration motivate shelf-stable recipes that can travel ambient supply chains, sustaining the sodium benzoate market even as premium labels test natural alternatives. Comparable patterns in Nigeria, Kenya, and Egypt underpin the 8.21% regional CAGR forecast for the Middle East and Africa through 2031.
Rising Clean-Label Reformulation Pressures
Consumers in the United States and Western Europe increasingly pay 7-20% premiums for beverages and sauces promoted as free from synthetic additives, redirecting preservative share toward rosemary extract, nisin, or cultured dextrose. European rules require proof that no alternative process can ensure safety, raising hurdles for sodium benzoate in premium SKUs. Laboratory work in 2025 showed that partially replacing sodium benzoate with honey and clove oil retained antimicrobial performance in cough syrups, hinting at hybrid systems that reduce synthetic load; however, scale-up and real-time shelf-life validation remain pending.
Other drivers and restraints analyzed in the detailed report include:
- Pharma Demand for Antimicrobial Excipients
- Adoption in Animal-Nutrition Acidifiers
- Safety Concerns on Benzene Formation with Vitamin C
For complete list of drivers and restraints, kindly check the Table Of Contents.
Segment Analysis
Food and beverages commanded 45.18% of the sodium benzoate market size in 2025, owing to carbonated soft drinks, fruit juices, pickles, and salad dressings that collectively consume more than half of the food-grade tonnage. Personal care and cosmetics, however, will log the fastest 8.34% CAGR through 2031 as shampoos, lotions, and micellar waters adopt the preservative to secure micro-stability at pH 4-5. Consumer backlash against parabens and reduced phenoxyethanol efficacy below pH 5 positions sodium benzoate as a technically robust alternative.
The sodium benzoate market continues to depend on processed foods for baseline demand, yet the cosmetics uptrend diversifies volume risk. In pharmaceuticals, pediatric syrups and topical creams underpin an 18-20% share, while industrial uses in corrosion-inhibition remain a small but stable niche. Consequently, long-term growth rests on dual momentum: sustained beverage consumption in emerging economies and cosmetic formulators' search for preservative systems compatible with low-pH, surfactant-rich bases.
Geography Analysis
Europe held 34.50% of global share in 2025, supported by high soft-drink intake and a sizeable pharmaceutical base. Germany's food-processing and France's beverage industries remain anchor buyers, yet retailers' preference for "E-number-free" labels is prompting gradual reformulation, particularly in children's products.
The Middle East and Africa will be the fastest-growing region at 8.21% CAGR during 2026-2031. Limited cold-chain infrastructure and packaged-food security programs boost reliance on ambient-stable preservatives. Regulatory regimes across Gulf Cooperation Council states mirror Codex limits, giving formulators confidence to maintain sodium benzoate usage without immediate costlier substitutions.
Asia-Pacific demand is propelled by India's double-digit packaged-food expansion and China's vast beverage output. While clean-label cues resonate in tier-1 Chinese cities, mass-market segments in ASEAN and South Asia still prioritize cost-effective shelf-life. The current demand in North America reflects a mature baseline and California's Proposition 65 influence; most reformulations substitute or reduce sodium benzoate in vitamin-fortified drinks rather than mainstream carbonated brands. South America rounds out global share with steady commodity-focused demand.
- LANXESS
- A.M. Food Chemical Co.
- American Elements
- Avantor Inc.
- Eastman Chemical Company
- Foodchem International Corporation
- Henan Fenghe Chemical
- Jarchem Industries
- Kelco
- Spectrum Chemical Mfg.
- Tengzhou Tenglong Food science and technology development co.,ltd
- Tengzhou Zhongzheng Biotech
- Tianjin Dongda Chemical Group
- Wuhua Youji
Additional Benefits:
- The market estimate (ME) sheet in Excel format
- 3 months of analyst support
TABLE OF CONTENTS
1 Introduction
- 1.1 Study Assumptions and Market Definition
- 1.2 Scope of the Study
2 Research Methodology
3 Executive Summary
4 Market Landscape
- 4.1 Market Overview
- 4.2 Market Drivers
- 4.2.1 Food and beverage preservative demand surge
- 4.2.2 Shift toward processed foods in APAC and Africa
- 4.2.3 Pharma demand for antimicrobial excipients
- 4.2.4 Adoption in animal-nutrition acidifiers
- 4.2.5 Electroplating and cool-water treatment uptake
- 4.3 Market Restraints
- 4.3.1 Rising 'clean-label' reformulation pressures
- 4.3.2 Safety concerns on benzene formation with Vit-C
- 4.3.3 EU and California tightening benzoate limits
- 4.4 Value Chain Analysis
- 4.5 Porter's Five Forces
- 4.5.1 Bargaining Power of Suppliers
- 4.5.2 Bargaining Power of Buyers
- 4.5.3 Threat of New Entrants
- 4.5.4 Threat of Substitutes
- 4.5.5 Competitive Rivalry
5 Market Size and Growth Forecasts (Value)
- 5.1 By Application
- 5.1.1 Food and Beverages
- 5.1.2 Pharmaceuticals
- 5.1.3 Personal Care and Cosmetics
- 5.1.4 Industrial (corrosion inhibitors, adhesives)
- 5.2 By Grade
- 5.2.1 Food Grade
- 5.2.2 Pharmaceutical Grade
- 5.2.3 Industrial Grade
- 5.3 By Form
- 5.3.1 Powder/Granules
- 5.3.2 Liquid
- 5.4 By Geography
- 5.4.1 Asia-Pacific
- 5.4.1.1 China
- 5.4.1.2 India
- 5.4.1.3 Japan
- 5.4.1.4 South Korea
- 5.4.1.5 ASEAN Countries
- 5.4.1.6 Rest of Asia-Pacific
- 5.4.2 North America
- 5.4.2.1 United States
- 5.4.2.2 Canada
- 5.4.2.3 Mexico
- 5.4.3 Europe
- 5.4.3.1 Germany
- 5.4.3.2 United Kingdom
- 5.4.3.3 France
- 5.4.3.4 Italy
- 5.4.3.5 Russia
- 5.4.3.6 Nordic Countries
- 5.4.3.7 Rest of Europe
- 5.4.4 South America
- 5.4.4.1 Brazil
- 5.4.4.2 Argentina
- 5.4.4.3 Rest of South America
- 5.4.5 Middle-East and Africa
- 5.4.5.1 Saudi Arabia
- 5.4.5.2 South Africa
- 5.4.5.3 Rest of Middle-East and Africa
- 5.4.1 Asia-Pacific
6 Competitive Landscape
- 6.1 Market Concentration
- 6.2 Strategic Moves
- 6.3 Market Share(%)/Ranking Analysis
- 6.4 Company Profiles (includes Global level Overview, Market level overview, Core Segments, Financials as available, Strategic Information, Products and Services, and Recent Developments)
- 6.4.1 LANXESS
- 6.4.2 A.M. Food Chemical Co.
- 6.4.3 American Elements
- 6.4.4 Avantor Inc.
- 6.4.5 Eastman Chemical Company
- 6.4.6 Foodchem International Corporation
- 6.4.7 Henan Fenghe Chemical
- 6.4.8 Jarchem Industries
- 6.4.9 Kelco
- 6.4.10 Spectrum Chemical Mfg.
- 6.4.11 Tengzhou Tenglong Food science and technology development co.,ltd
- 6.4.12 Tengzhou Zhongzheng Biotech
- 6.4.13 Tianjin Dongda Chemical Group
- 6.4.14 Wuhua Youji
7 Market Opportunities and Future Outlook
- 7.1 White-space and Unmet-need Assessment

