
PUBLISHER: Mordor Intelligence | PRODUCT CODE: 2062110

PUBLISHER: Mordor Intelligence | PRODUCT CODE: 2062110
PFAS Filtration - Market Share Analysis, Industry Trends & Statistics, Growth Forecasts (2026 - 2031)
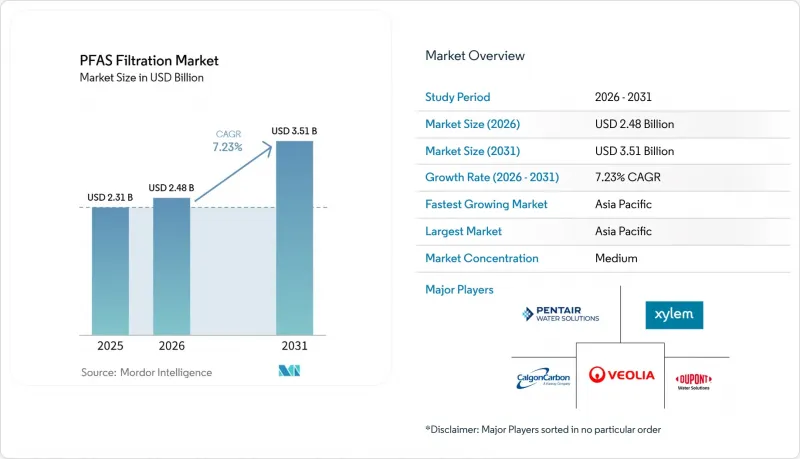
According to Mordor Intelligence, the pFAS filtration market size is expected to grow from USD 2.31 billion in 2025 to USD 2.48 billion in 2026 and is forecast to reach USD 3.51 billion by 2031 at 7.23% CAGR over 2026-2031.
This report is Segmented by Technology (GAC, Anion-Exchange Resins, RO, NF, Other Technologies), Media Type (Carbon-Based, Resin-Based, Zeolites, Biochar, Polymeric Membranes), Application (Drinking Water, Industrial Wastewater, Groundwater Remediation, and More), and Geography (APAC, North America, Europe, South America, MEA). Market Forecasts are Provided in Terms of Value (USD).
Global PFAS Filtration Market Trends and Insights
Infrastructure-Bill Funding for Utilities
The U.S. Bipartisan Infrastructure Law allocated USD 10 billion for PFAS and emerging-contaminant remediation through the Drinking Water and Clean Water State Revolving Funds, which has accelerated project approvals in several states. North Carolina directed USD 133.7 million toward a GAC retrofit in Fayetteville, planned for 2026-2029. Similarly, Calhoun County in Alabama secured USD 288.3 million for a reverse-osmosis (RO) system, with an 80-year lifecycle value of USD 1.25 billion. In Europe, cohesion-fund grants in Germany and France have reduced procurement timelines, requiring vendors to maintain larger inventories. This consistent capital inflow is driving demand in the PFAS filtration market, although shorter bid cycles are creating challenges for supplier margins.
PFAS-Free Certifications by F&B and Textile Firms
Private-label suppliers now rely on NSF International's P537 protocol and Intertek's PFAS-Free seal as essential gateways to major U.S. retailers. In a bid to meet 2026 audit mandates, textile mills in Bangladesh and Vietnam are proactively installing point-of-use GAC skids. This move not only fortifies the PFAS filtration market against the fluctuations of municipal budgets but also underscores the growing importance of certifications. While these certification-driven orders may be smaller in scale, they exhibit resilience against legislative holdups, ensuring a consistent revenue stream for equipment manufacturers throughout market cycles.
Supply Shortages of Premium GAC and Specialty Resins
Arq's Alabama plant is the only source of virgin GAC in North America, producing 170 million lbs annually, while demand is expected to surpass 300 million lbs by 2025. Coconut-shell media is priced at USD 1,800-2,500 per ton, compared to USD 800-1,200 per ton for coal-based carbon. Typhoon-related port disruptions in the Philippines have increased lead times to 20 weeks in 2024. For anion-exchange beads such as Purolite A694E and Lanxess TP 109, logistics delays of 12 to 20 weeks are prompting utilities to secure two-year inventories in advance. These supply chain challenges are creating advantages for established vertically integrated players, while discouraging new entrants, which is likely to limit short-term growth in the PFAS filtration market.
Other drivers and restraints analyzed in the detailed report include:
- Emergence of Regenerable Adsorbents
- Hybrid Capture-to-Destruction Skids at Military and Remote Sites
- Regulatory Shift Toward Destruction Eroding Filtration Demand
For complete list of drivers and restraints, kindly check the Table Of Contents.
Segment Analysis
Anion-exchange resins are set to grow at a 7.56% CAGR, outpacing the broader PFAS filtration market. Utilities are increasingly favoring media that can be regenerated using methanol, sodium chloride, or UV-sulfite processes, leading to a notable 40-60% reduction in disposal costs. Highlighting the municipal push for these regenerable systems, Eau Claire, Wisconsin, is set to launch a USD 20 million, 16-vessel ion-exchange plant in late spring 2026. While granular activated carbon commands a dominant 47.11% of the revenue, thanks to its legacy installations and simpler O&M protocols, rising landfill tipping fees, now exceeding USD 200/t, are diminishing its cost edge in coastal regions.
Reverse-osmosis and nanofiltration membranes, boasting a 95%+ rejection rate for short-chain PFAS, are gaining traction as regulators shift focus from C8 to the C4-C6 spectrum. In a strategic move, DuPont's 2025 acquisition of Sinochem is poised to amplify FilmTec's production across the Asia-Pacific, with a keen eye on semiconductor fabs discharging PFAS-laden concentrates. Technologies like electrochemical oxidation, Axine's electraCLEAR, E2METRIX's Obreak, and Bioionix's reactor boast a 95-99.99% destruction rate. However, they come with an energy cost of 1-2.5 kWh/gal, which may hinder immediate adoption. Meanwhile, powdered activated carbon finds its niche in treating batch landfill leachate, especially where capital budgets are tight.
Geography Analysis
Asia-Pacific, accounting for 42.25% of 2025's revenue, is set to lead with a projected CAGR of 7.95%. Following Japan's April 2026 ban on 138 compounds, cities like Tokyo, Osaka, and Nagoya are now retrofitting to meet the stringent 50 ng/L PFOS/PFOA target. In 2025, China broadened its PFAS monitoring to encompass 300 cities, with provincial regulators advocating for sub-20 ng/L caps on industrial effluents. This regulatory wave coincides with DuPont's strategic timing of its Ningbo membrane plant. While South Korea, Vietnam, and Thailand lag in legislation, the demand for point-of-use GAC, driven by supplier audits, carves out fragmented growth pockets in the PFAS filtration market.
North America stands as the second largest region. The EPA's final rule, supported by a USD 10 billion allocation from the Infrastructure Law, is set to fuel a surge in GAC, ion-exchange, and RO projects, extending through 2029. Canada, tightening its standards to 30 ng/L in 2024, now tracks discharges exceeding 100 kg in its National Pollutant Release Inventory. While Mexico has not established federal limits, utilities along the border are proactively treating PFAS in shared waters, indirectly boosting regional expenditures.
Europe's Drinking Water Directive, effective 1 January 2026, sets a cap of 100 ng/L for Total PFAS and 500 ng/L for the sum, leading to a EUR 450 million retrofit expenditure across Germany, France, and the Netherlands. The U.K., maintaining a 100 ng/L threshold, is also backing GAC-ozone regeneration research at Swansea University through Ofwat's innovation funds. In South America and the Middle East-Africa, the landscape is still nascent; while Brazil and Saudi Arabia have conducted baseline assessments, they are yet to establish enforceable standards, hinting at potential growth once regulations take shape.
- 3M
- A. O. Smith
- Aquatech
- Chart Industries
- Clean TeQ Water
- Culligan Water
- Cyclopure, Inc.
- DuPont
- Hydranautics - A Nitto Group Company
- Koch Separation Solutions
- KURARAY CO., LTD.
- LANXESS
- Ovivo Inc.
- Pentair plc
- Purolite
- Veolia
- Xylem
- Zurn Elkay Water Solutions Corporation
Additional Benefits:
- The market estimate (ME) sheet in Excel format
- 3 months of analyst support
TABLE OF CONTENTS
1 Introduction
- 1.1 Study Assumptions and Market Definition
- 1.2 Scope of the Study
2 Research Methodology
3 Executive Summary
4 Market Landscape
- 4.1 Market Overview
- 4.2 Market Drivers
- 4.2.1 Infrastructure-bill funding for utilities
- 4.2.2 "PFAS-Free" certifications by Food and Beverage and textile firms
- 4.2.3 Emergence of regenerable adsorbents
- 4.2.4 Hybrid capture-to-destruction skids at military and remote sites
- 4.2.5 Real-time PFAS sensors enabling proactive media changeouts
- 4.3 Market Restraints
- 4.3.1 Supply shortages of premium GAC and specialty resins
- 4.3.2 Regulatory shift toward destruction eroding filtration demand
- 4.3.3 Rapid switch to fluorine-free chemistries reducing retrofit demand
- 4.4 Value Chain Analysis
- 4.5 Porter's Five Forces
- 4.5.1 Threat of New Entrants
- 4.5.2 Bargaining Power of Buyers
- 4.5.3 Bargaining Power of Suppliers
- 4.5.4 Threat of Substitutes
- 4.5.5 Competitive Rivalry
5 Market Size and Growth Forecasts (Value)
- 5.1 By Technology
- 5.1.1 Granular Activated Carbon (GAC)
- 5.1.2 Anion-Exchange Resins
- 5.1.3 Reverse Osmosis (RO)
- 5.1.4 Nanofiltration (NF)
- 5.1.5 Other Technologies (Electrochemical Oxidation, Powdered Activated Carbon (PAC), etc.)
- 5.2 By Media Type
- 5.2.1 Carbon-Based Media
- 5.2.2 Resin-Based Media
- 5.2.3 Zeolites and Aluminosilicates
- 5.2.4 Biochar and Biomass-Derived Media
- 5.2.5 Polymeric and Composite Membranes
- 5.3 By Application
- 5.3.1 Drinking Water Treatment
- 5.3.2 Industrial Wastewater
- 5.3.3 Groundwater Remediation
- 5.3.4 Municipal Wastewater
- 5.3.5 Other Applications (Landfill Leachate, Fire-Fighting Foam Run-Off, etc.)
- 5.4 By Geography
- 5.4.1 Asia-Pacific
- 5.4.1.1 China
- 5.4.1.2 Japan
- 5.4.1.3 India
- 5.4.1.4 South Korea
- 5.4.1.5 ASEAN Countries
- 5.4.1.6 Rest of Asia-Pacific
- 5.4.2 North America
- 5.4.2.1 United States
- 5.4.2.2 Canada
- 5.4.2.3 Mexico
- 5.4.3 Europe
- 5.4.3.1 Germany
- 5.4.3.2 United Kingdom
- 5.4.3.3 France
- 5.4.3.4 Italy
- 5.4.3.5 Spain
- 5.4.3.6 Russia
- 5.4.3.7 NORDIC Countries
- 5.4.3.8 Rest of Europe
- 5.4.4 South America
- 5.4.4.1 Brazil
- 5.4.4.2 Argentina
- 5.4.4.3 Rest of South America
- 5.4.5 Middle-East and Africa
- 5.4.5.1 Saudi Arabia
- 5.4.5.2 South Africa
- 5.4.5.3 Rest of Middle-East and Africa
- 5.4.1 Asia-Pacific
6 Competitive Landscape
- 6.1 Market Concentration
- 6.2 Strategic Moves
- 6.3 Market Share(%)/Ranking Analysis
- 6.4 Company Profiles (includes Global Overview, Market Overview, Core Segments, Financials, Strategic Information, Products and Services, Recent Developments)
- 6.4.1 3M
- 6.4.2 A. O. Smith
- 6.4.3 Aquatech
- 6.4.4 Chart Industries
- 6.4.5 Clean TeQ Water
- 6.4.6 Culligan Water
- 6.4.7 Cyclopure, Inc.
- 6.4.8 DuPont
- 6.4.9 Hydranautics - A Nitto Group Company
- 6.4.10 Koch Separation Solutions
- 6.4.11 KURARAY CO., LTD.
- 6.4.12 LANXESS
- 6.4.13 Ovivo Inc.
- 6.4.14 Pentair plc
- 6.4.15 Purolite
- 6.4.16 Veolia
- 6.4.17 Xylem
- 6.4.18 Zurn Elkay Water Solutions Corporation
7 Market Opportunities and Future Outlook
- 7.1 White-space and Unmet-need Assessment

