
PUBLISHER: Mordor Intelligence | PRODUCT CODE: 2062199

PUBLISHER: Mordor Intelligence | PRODUCT CODE: 2062199
Cable Assembly - Market Share Analysis, Industry Trends & Statistics, Growth Forecasts (2026 - 2031)
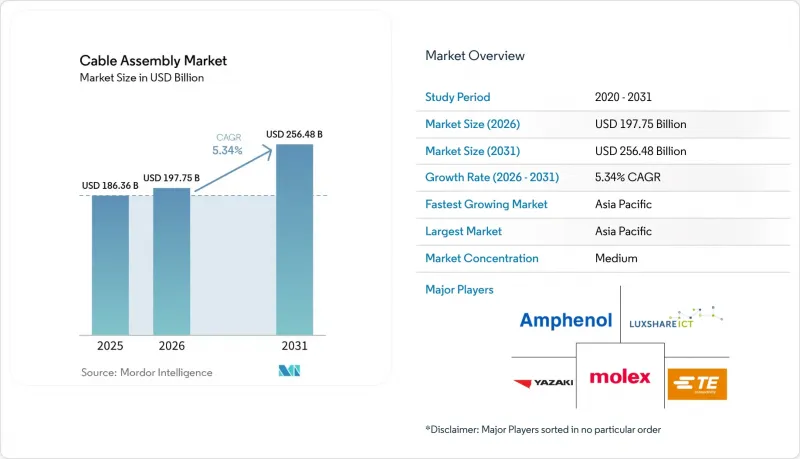
According to Mordor Intelligence, the cable assembly market size is projected to be USD 186.36 billion in 2025, USD 197.75 billion in 2026, and reach USD 256.48 billion by 2031, growing at a CAGR of 5.34% from 2026 to 2031.
This report is Segmented by Product Type (Custom Cable Assemblies, Standard/Off-the-Shelf Assemblies, Overmolded Cable Assemblies, Fiber-Optic Assemblies, and More), Cable Type (Coaxial, and More), End-Use Industry (Automotive and Transportation, Telecommunications, and More), Application (Data Transfer and Communication, and More), and Geography. The Market Forecasts are Provided in Terms of Value (USD).
Global Cable Assembly Market Trends and Insights
Surge In High-Speed Data-Center Interconnect Demand
Hyperscale operators are migrating from 400 Gbps to 800 Gbps and 1.6 Tbps optics, compressing refresh cycles to roughly two years and lifting fiber purchases under multi-year supply agreements. Active optical cables dissipate roughly half the port power of direct-attach copper, a difference that favors them in dense GPU racks where a single server can draw 10 kilowatts. Automated polishing lines that certify more than 10,000 termini per shift remain scarce, giving scale players an execution edge. IEEE 802.3's ratification of 1.6 Tbps Ethernet in early 2026 will accelerate replacement of installed 200 G and 400 G inventories, sustaining double-digit fiber-assembly growth well into the forecast window.
Expansion Of 5 G And Fiber-To-The-Home Deployments
United States FTTH construction passed 11.8 million additional premises during 2025, absorbing 1.2-1.5 drop-cable assemblies per home as installers pivot from fusion splicing to push-on connectors. Pre-terminated harnesses cost up to 35% more per unit yet cut truck-roll labor by around one-third, an attractive trade-off in markets where field labor exceeds USD 75 per hour. Parallel 5 G mid-band densification boosts demand for hybrid copper-fiber feeder cables that integrate DC power for remote radio heads, while rural fixed-wireless rollouts favor NEMA 4X-rated backhaul assemblies in difficult trench terrain.
Volatility In Copper and Specialty Metal Prices
London Metal Exchange copper futures climbed 63% from early 2025 to mid-2026, inflating the raw-material cost of goods by roughly one-fifth for assembly houses. Automotive contracts offer indexed adjustments, yet 60-90-day lags compress gross margin by as much as 400 basis points during rapid spikes. Smaller regional assemblers, lacking hedging or volume rebates on phosphor bronze and beryllium copper, apply surcharges or shift toward aluminum conductors that save 60-70% per kilogram but sacrifice 40% conductivity. Electric-vehicle harnesses averaging 80-100 kg of copper would incur up to USD 1,000 in extra wiring cost at a steady USD 10,000 per metric-ton price, a figure automakers struggle to absorb in full.
Other drivers and restraints analyzed in the detailed report include:
- Electrification And ADAS-Driven Automotive Wiring Complexity
- Industrial Automation and Smart-Factory Rollouts
- Stringent RoHS/REACH And Halogen-Free Material Mandates
For complete list of drivers and restraints, kindly check the Table Of Contents.
Segment Analysis
Fiber-optic assemblies held 36.54% of 2025 revenue and are projected to expand at a 6.06% CAGR, outpacing legacy copper offerings as hyperscale campuses migrate to 800 Gbps optics. The cable assembly market size for fiber products benefits from Meta's multibillion-dollar Corning agreement, which pre-books capacity and signals confidence in long-term demand. Custom cable assemblies, about 28-30% of sales, underpin automotive, aerospace, and medical projects where just-in-time kitting shrinks' inventory on original equipment manufacturers' floors.
Standard off-the-shelf assemblies remain price sensitive, with Chinese contractors routing basic USB-C cables at sub-USD 2-unit costs, compressing margins outside retail-branded niches. Overmolded designs and high-frequency assemblies sustain gross margins near 30% because ingress-protection and insertion-loss guarantees are hard to replicate cheaply. Ribbon and flat-cable formats serve ultrathin consumer devices but face partial substitution from flexible printed circuits that co-laminate signal and power layers.
Fiber-optic cables accounted for 37.72% of 2025 revenue and will continue to lead at a 6.11% CAGR as single-mode specifications with sub-0.3 dB insertion loss become standard in spine-leaf architectures. Coaxial lines, roughly one-fifth of the cable assembly market size, grow more slowly as 5 G installers prefer lower-loss corrugated designs, yet they stay critical for antenna feeders that exceed 100 meters.
Power cables are gaining momentum from 800-volt vehicle architectures, lifting their share of the cable assembly market by mid-single digits as insulation ratings and current thresholds rise. RF and microwave cables, buoyed by electronic-warfare upgrades, sustain mid-single-digit growth on defense budgets that favour higher-frequency radar. Cat6A and Cat7 twisted-pair lines refresh enterprise campuses, but commoditization tempers growth to the low-single-digit range.
Geography Analysis
Asia-Pacific contributed 42.12% of global 2025 revenue and is set to rise at a 5.78% CAGR as TE Connectivity, Hirose Electric, and Luxshare commit fresh capital to the Philippines, India, and mainland China. Japan and South Korea invest in optical-fiber capacity to serve domestic cloud expansion, whereas Vietnam picks up consumer-electronics programs as brands diversify sourcing beyond China.
North America sits near 29% share, with reshoring activity accelerating after Nexans' Electro Cables acquisition and multiple state incentives targeting critical infrastructure supply chains. Mexico advances as a nearshoring hub for harnesses feeding U.S. assembly plants, balancing higher U.S. labor costs.
Europe holds roughly one-fifth of revenue; compliance burdens from RoHS and REACH weigh on smaller shops, yet premium niches such as AI-datacenter fiber and 800-volt vehicle harnesses thrive. Middle East and Africa and South America collectively remain below 10% but log steady orders for submarine links, transit electrification, and regional data-center buildouts.
- TE Connectivity Ltd.
- Amphenol Corporation
- Molex LLC
- Luxshare Precision Industry Co., Ltd.
- Yazaki Corporation
- Aptiv PLC
- Sumitomo Electric Industries, Ltd.
- Rosenberger Hochfrequenztechnik GmbH & Co. KG
- Carlisle Interconnect Technologies (Carlisle Companies Inc.)
- Samtec, Inc.
- HARTING Technology Group
- JAE Electronics, Inc. (Japan Aviation Electronics Industry, Ltd.)
- LEMO SA
- Hirose Electric Co., Ltd.
- Radiall SA
- Belden Inc.
- BizLink Holding Inc.
- Nexans SA
- W. L. Gore & Associates, Inc.
- 3M Company
Additional Benefits:
- The market estimate (ME) sheet in Excel format
- 3 months of analyst support
TABLE OF CONTENTS
1 INTRODUCTION
- 1.1 Study Assumptions and Market Definition
- 1.2 Scope of the Study
2 RESEARCH METHODOLOGY
3 EXECUTIVE SUMMARY
4 MARKET LANDSCAPE
- 4.1 Market Overview
- 4.2 Market Drivers
- 4.2.1 Surge in High-Speed Data-Center Interconnect Demand
- 4.2.2 Expansion of 5G and Fiber-to-the-Home Deployments
- 4.2.3 Electrification and ADAS-Driven Automotive Wiring Complexity
- 4.2.4 Industrial Automation and Smart-Factory Roll-outs
- 4.2.5 Quantum-Computing Cryogenic Cabling Requirements
- 4.2.6 eVTOL and Urban-Air-Mobility Modular Power Harnesses
- 4.3 Market Restraints
- 4.3.1 Volatility in Copper and Specialty Metal Prices
- 4.3.2 Stringent RoHS/REACH and Halogen-Free Material Mandates
- 4.3.3 Tight Supply of High-Performance Fluoropolymer Dielectrics
- 4.3.4 Signal-Integrity Challenges in Ultra-Miniature High-Freq Connectors
- 4.4 Industry Value-Chain Analysis
- 4.5 Regulatory Landscape
- 4.6 Technological Outlook
- 4.7 Impact of Macroeconomic Factors on the Market
- 4.8 Porter's Five Forces Analysis
- 4.8.1 Threat of New Entrants
- 4.8.2 Bargaining Power of Buyers
- 4.8.3 Bargaining Power of Suppliers
- 4.8.4 Threat of Substitutes
- 4.8.5 Competitive Rivalry
5 MARKET SIZE AND GROWTH FORECASTS (VALUE)
- 5.1 By Product Type
- 5.1.1 Custom Cable Assemblies
- 5.1.2 Standard / Off-the-Shelf Assemblies
- 5.1.3 Overmolded Cable Assemblies
- 5.1.4 Fiber-Optic Assemblies
- 5.1.5 Ribbon / Flat-Cable Assemblies
- 5.1.6 High-Speed and High-Freq Assemblies
- 5.2 By Cable Type
- 5.2.1 Coaxial
- 5.2.2 Fiber-Optic
- 5.2.3 Ribbon / Flat
- 5.2.4 Twisted-Pair / Networking
- 5.2.5 RF and Microwave
- 5.2.6 Power
- 5.3 By End-Use Industry
- 5.3.1 Automotive and Transportation
- 5.3.2 Telecommunications
- 5.3.3 Consumer Electronics
- 5.3.4 Industrial Automation and Robotics
- 5.3.5 Healthcare and Medical Devices
- 5.3.6 Aerospace and Defense
- 5.3.7 IT and Data Centers
- 5.3.8 Energy and Power
- 5.3.9 Rail and Mass Transit
- 5.4 By Application
- 5.4.1 Data Transfer and Communication
- 5.4.2 Power Transmission
- 5.4.3 RF / Microwave Signal
- 5.4.4 High-Performance Computing
- 5.4.5 Sensor and Control
- 5.4.6 Charging and Battery Management
- 5.4.7 Lighting and Display
- 5.5 By Geography
- 5.5.1 North America
- 5.5.1.1 United States
- 5.5.1.2 Canada
- 5.5.1.3 Mexico
- 5.5.2 South America
- 5.5.2.1 Brazil
- 5.5.2.2 Argentina
- 5.5.2.3 Rest of South America
- 5.5.3 Europe
- 5.5.3.1 Germany
- 5.5.3.2 United Kingdom
- 5.5.3.3 France
- 5.5.3.4 Russia
- 5.5.3.5 Rest of Europe
- 5.5.4 Asia-Pacific
- 5.5.4.1 China
- 5.5.4.2 Japan
- 5.5.4.3 India
- 5.5.4.4 South Korea
- 5.5.4.5 Australia
- 5.5.4.6 Rest of Asia-Pacific
- 5.5.5 Middle East
- 5.5.5.1 Saudi Arabia
- 5.5.5.2 United Arab Emirates
- 5.5.5.3 Rest of Middle East
- 5.5.6 Africa
- 5.5.6.1 South Africa
- 5.5.6.2 Egypt
- 5.5.6.3 Rest of Africa
- 5.5.1 North America
6 COMPETITIVE LANDSCAPE
- 6.1 Market Concentration
- 6.2 Strategic Moves
- 6.3 Market Share Analysis
- 6.4 Company Profiles (includes Global Level Overview, Market Level Overview, Core Segments, Financials as available, Strategic Information, Market Rank/Share, Products and Services, Recent Developments)
- 6.4.1 TE Connectivity Ltd.
- 6.4.2 Amphenol Corporation
- 6.4.3 Molex LLC
- 6.4.4 Luxshare Precision Industry Co., Ltd.
- 6.4.5 Yazaki Corporation
- 6.4.6 Aptiv PLC
- 6.4.7 Sumitomo Electric Industries, Ltd.
- 6.4.8 Rosenberger Hochfrequenztechnik GmbH & Co. KG
- 6.4.9 Carlisle Interconnect Technologies (Carlisle Companies Inc.)
- 6.4.10 Samtec, Inc.
- 6.4.11 HARTING Technology Group
- 6.4.12 JAE Electronics, Inc. (Japan Aviation Electronics Industry, Ltd.)
- 6.4.13 LEMO SA
- 6.4.14 Hirose Electric Co., Ltd.
- 6.4.15 Radiall SA
- 6.4.16 Belden Inc.
- 6.4.17 BizLink Holding Inc.
- 6.4.18 Nexans SA
- 6.4.19 W. L. Gore & Associates, Inc.
- 6.4.20 3M Company
7 MARKET OPPORTUNITIES AND FUTURE OUTLOOK
- 7.1 White-Space and Unmet-Need Assessment

