
PUBLISHER: Mordor Intelligence | PRODUCT CODE: 2062471

PUBLISHER: Mordor Intelligence | PRODUCT CODE: 2062471
Commercial Distributed Energy Generation - Market Share Analysis, Industry Trends & Statistics, Growth Forecasts (2026 - 2031)
According to Mordor Intelligence, the commercial distributed energy generation market size was valued at USD 150.40 billion in 2025 and is estimated to grow from USD 162.42 billion in 2026 to reach USD 234.26 billion by 2031, at a CAGR of 7.60% during the forecast period (2026-2031).
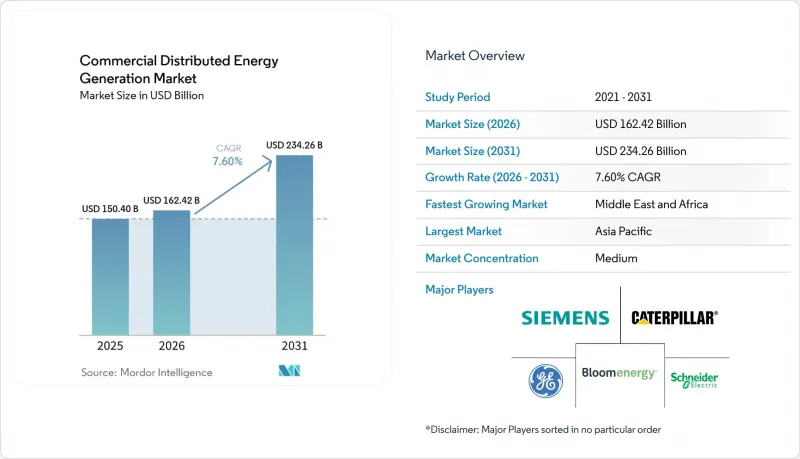
This report is Segmented by Technology (Solar PV, Wind Turbines, Fuel Cells, CHP, Battery-Storage-Coupled DER, Others), Application (Office Buildings, Retail, Data Centers, Educational Institutions, Hospitals, Warehouses, Airports, Others), and Geography (North America, Europe, Asia-Pacific, South America, Middle East and Africa). Market Forecasts are Provided in Value (USD).
Global Commercial Distributed Energy Generation Market Trends and Insights
Declining LCOE of Solar PV & Wind
Utility-scale solar reached USD 29 per MWh in 2025, and commercial rooftop systems now deliver USD 50-70 per MWh in high-insolation zones, undercutting retail tariffs in 23 U.S. states. Chinese polysilicon oversupply pushed spot module prices below USD 0.10 per watt, while rapid-shutdown electronics trimmed installation labor by 30%. Companies, therefore, face a choice between fixed-rate PPAs and self-financed arrays with four-to-six-year paybacks. The fall in costs explains why solar is the fastest-growing slice of the commercial distributed energy generation market.
Corporate Renewable PPAs & Net-Zero Targets
Cumulative corporate renewable PPAs reached 50 GW worldwide by end-2025, 60% of which originated in North America and Europe. Portfolio-scale deals such as Google's 1 GW contract with TotalEnergies and Microsoft's 10.5 GW partnership with Brookfield bundle multiple technologies and oblige developers to add two-to-four-hour batteries. Because the obligation to deliver round-the-clock clean power shifts intermittency risk away from the buyer, PPAs accelerate project bankability and drive deeper penetration of distributed assets on commercial sites.
High Upfront CAPEX & Long Payback Period
Commercial solar still costs USD 1.57 per watt in the United States, and fuel-cell CHP reaches USD 6.00 per watt, translating to multi-million-dollar investments that small businesses rarely self-finance. Energy-as-a-service contracts remove capital barriers but exclude customers lacking investment-grade credit, leaving 60% of potential offtakers unserved.
Other drivers and restraints analyzed in the detailed report include:
- Extension of Net-Metering & ITC-Type Incentives
- Resilience Demand Amid Rising Grid Outage Risks
- Distribution-Grid Hosting-Capacity Saturation
For complete list of drivers and restraints, kindly check the Table Of Contents.
Segment Analysis
Fuel cells captured 37.6% of the commercial distributed energy generation market share in 2025, reflecting their value in hospitals, data centers, and industrial sites that need uninterrupted heat and power. Bloom Energy deployed more than 100 MW at Equinix facilities and lined up a 900 MW hydrogen-ready contract in Wyoming, moves that underpin its leadership. The solar segment is scaling faster, expanding at a 14.4% CAGR to 2031 as module prices dip below USD 0.10 per watt. Coupling rooftop PV with two-to-four-hour batteries slashes dependence on grid imports during evening peaks and trims demand charges, hastening payback to five to six years.
Wind turbines remain niche because zoning rules restrict 100-500 kW machines to industrial campuses with generous setbacks, while microturbine and reciprocating-engine hybrids continue to dominate off-grid mining and agribusiness use cases. Battery prices falling to USD 120 per kWh in 2025 spur adoption of one-to-two-hour storage as an add-on rather than a standalone system, reinforcing solar's position as the default growth engine in the commercial distributed energy generation market context. In parallel, hydrogen-blended CHP offers a pathway to deep decarbonization without sacrificing dispatchability, a feature that could preserve fuel-cell relevance during the forecast period.
Geography Analysis
Asia-Pacific dominated with 45.3% revenue in 2025. China alone installed 18 GW of commercial rooftop solar in 2025 and mandates 20-30% on-site renewables within new industrial parks. India's open-access reforms let corporations bypass distribution companies and have propelled the commercial distributed energy generation market in the country to 35% annual growth during 2025. ASEAN economies are filling a USD 16 billion financing gap with local banks and development finance institutions to unlock rooftop potential.
The Middle East and Africa are forecast to grow at 13.1% CAGR to 2031, the fastest worldwide. Gulf states deploy solar-plus-storage to free natural gas for export, while South Africa, Kenya, and Nigeria rely on diesel-solar hybrids to maintain uptime amid grids that serve industry less than 60% of the time.
North America retained a significant share of the commercial distributed energy generation market in 2025, but interconnection queues stretching up to three years and the scheduled sunset of federal tax credits after 2027 weigh on momentum. Europe's saturation of low-voltage feeders in Germany and Spain forces costly grid upgrades. South America remains nascent outside Brazil and Chile, though Argentina's liberalizing reforms in 2025 could accelerate adoption after 2027.
- Siemens AG
- Schneider Electric
- Caterpillar Inc.
- General Electric (GE Vernova)
- Bloom Energy
- Sunnova Energy
- Enel X
- Aggreko Ltd
- Eaton Corporation
- Tesla Energy
- ABB Ltd.
- Johnson Controls
- Engie SA
- Cummins Inc.
- Wartsila Corporation
- Capstone Green Energy
- Generac Power Systems
- Vicinity Energy
- Veolia (Microgrids)
- NextEra Energy Resources
Additional Benefits:
- The market estimate (ME) sheet in Excel format
- 3 months of analyst support
TABLE OF CONTENTS
1 Introduction
- 1.1 Study Assumptions & Market Definition
- 1.2 Scope of the Study
2 Research Methodology
3 Executive Summary
4 Market Landscape
- 4.1 Market Overview
- 4.2 Market Drivers
- 4.2.1 Declining LCOE of Solar PV & Wind
- 4.2.2 Corporate renewable PPAs & net-zero targets
- 4.2.3 Extension of net-metering & ITC-type incentives
- 4.2.4 Resilience demand amid rising grid outage risks
- 4.2.5 AI-enabled DER orchestration platforms
- 4.2.6 Hydrogen-ready micro-cogeneration with fuel cells
- 4.3 Market Restraints
- 4.3.1 High upfront CAPEX & long payback period
- 4.3.2 Evolving interconnection & tariff complexity
- 4.3.3 Distribution-grid hosting-capacity saturation
- 4.3.4 ESG traceability scrutiny for PV & wind supply chains
- 4.4 Supply-Chain Analysis
- 4.5 Regulatory Landscape
- 4.6 Technological Outlook
- 4.7 Porter's Five Forces
- 4.7.1 Threat of New Entrants
- 4.7.2 Bargaining Power of Suppliers
- 4.7.3 Bargaining Power of Buyers
- 4.7.4 Threat of Substitutes
- 4.7.5 Competitive Rivalry
5 Market Size & Growth Forecasts
- 5.1 By Technology
- 5.1.1 Solar PV
- 5.1.2 Wind Turbines
- 5.1.3 Fuel Cells
- 5.1.4 Combined Heat and Power (CHP)
- 5.1.5 Battery-Storage-Coupled DER
- 5.1.6 Others
- 5.2 By Application
- 5.2.1 Office Buildings
- 5.2.2 Retail Stores
- 5.2.3 Data Centers
- 5.2.4 Educational Institutions
- 5.2.5 Hospitals
- 5.2.6 Warehouses and Logistics Centres
- 5.2.7 Airports and Transport Hubs
- 5.2.8 Others (incl campuses, hotels)
- 5.3 By Geography
- 5.3.1 North America
- 5.3.1.1 United States
- 5.3.1.2 Canada
- 5.3.1.3 Mexico
- 5.3.2 Europe
- 5.3.2.1 United Kingdom
- 5.3.2.2 Germany
- 5.3.2.3 France
- 5.3.2.4 Spain
- 5.3.2.5 Nordic Countries
- 5.3.2.6 Russia
- 5.3.2.7 Rest of Europe
- 5.3.3 Asia-Pacific
- 5.3.3.1 China
- 5.3.3.2 India
- 5.3.3.3 Japan
- 5.3.3.4 South Korea
- 5.3.3.5 ASEAN Countries
- 5.3.3.6 Australia and New Zealand
- 5.3.3.7 Rest of Asia-Pacific
- 5.3.4 South America
- 5.3.4.1 Brazil
- 5.3.4.2 Argentina
- 5.3.4.3 Colombia
- 5.3.4.4 Rest of South America
- 5.3.5 Middle East and Africa
- 5.3.5.1 United Arab Emirates
- 5.3.5.2 Saudi Arabia
- 5.3.5.3 South Africa
- 5.3.5.4 Egypt
- 5.3.5.5 Rest of Middle East and Africa
- 5.3.1 North America
6 Competitive Landscape
- 6.1 Market Concentration
- 6.2 Strategic Moves (M&A, Partnerships, PPAs)
- 6.3 Market Share Analysis (Market Rank/Share for key companies)
- 6.4 Company Profiles (includes Global level Overview, Market level overview, Core Segments, Financials as available, Strategic Information, Products & Services, and Recent Developments)
- 6.4.1 Siemens AG
- 6.4.2 Schneider Electric
- 6.4.3 Caterpillar Inc.
- 6.4.4 General Electric (GE Vernova)
- 6.4.5 Bloom Energy
- 6.4.6 Sunnova Energy
- 6.4.7 Enel X
- 6.4.8 Aggreko Ltd
- 6.4.9 Eaton Corporation
- 6.4.10 Tesla Energy
- 6.4.11 ABB Ltd.
- 6.4.12 Johnson Controls
- 6.4.13 Engie SA
- 6.4.14 Cummins Inc.
- 6.4.15 Wartsila Corporation
- 6.4.16 Capstone Green Energy
- 6.4.17 Generac Power Systems
- 6.4.18 Vicinity Energy
- 6.4.19 Veolia (Microgrids)
- 6.4.20 NextEra Energy Resources
7 Market Opportunities & Future Outlook
- 7.1 White-space & Unmet-Need Assessment

