
PUBLISHER: Mordor Intelligence | PRODUCT CODE: 2062477

PUBLISHER: Mordor Intelligence | PRODUCT CODE: 2062477
Tight Gas - Market Share Analysis, Industry Trends & Statistics, Growth Forecasts (2026 - 2031)
According to Mordor Intelligence, the tight gas market size is projected to be USD 53.63 billion in 2025, USD 57.01 billion in 2026, and reach USD 75.61 billion by 2031, growing at a CAGR of 5.81% from 2026 to 2031.
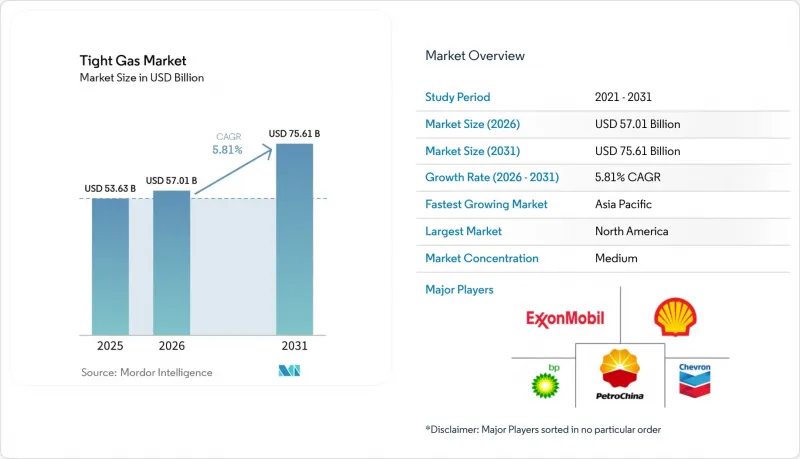
This report is Segmented by Resource Type (Sandstone, Limestone, Others), Well Type (Conventional, Unconventional), Location (Offshore, Onshore), End-User (Oil & Gas Majors, Utilities, Independent Producers, Government & NOCs, Others), and Geography (North America, Europe, Asia-Pacific, South America, Middle East and Africa). The Market Forecasts are Provided in Terms of Value (USD).
Global Tight Gas Market Trends and Insights
Declining Conventional Gas Reserves
Legacy offshore and onshore conventional gas fields now decline 6.8% per year globally, forcing producers to redirect roughly USD 500 billion of annual upstream spending toward unconventional deposits . North Sea facilities commissioned in the 1970s operate below 30% of their original plateau rates, while U.S. shallow-water Gulf of Mexico output has halved since 2015. A Haynesville horizontal well costs near USD 8 million versus USD 50-100 million for a new offshore platform, giving tight gas a rapid payback even at mid-cycle prices. CNPC reported Sichuan Basin tight-gas output topping 40 billion m3 in 2025, helping offset declines at Daqing and Shengli. European players are rebalancing similarly; TotalEnergies exited mature North Sea assets in 2024 to fund Argentina's Vaca Muerta tight-gas push.
Rising Global Gas-Fired Power Demand
Global additions of 85 GW of gas-fired capacity in 2025 stemmed from coal-to-gas switching in Asia-Pacific and fast-growing data-center loads in North America . U.S. dry-gas production is set to rise from 120.8 Bcf/d in 2026 to 122.3 Bcf/d in 2027, with tight formations supplying 60% of the increase. Long-dated LNG offtake contracts underwrite upstream economics; U.S. projects sanctioned in 2025 added more than 80 bcm/yr of liquefaction. Qatar's North Field Phase 2 will contribute 1.2 Bcf/d of tight-carbonate feedstock by 2028. India cleared 12 GW of gas-peaking plants in 2025 that will lean on Krishna-Godavari tight gas.
Environmental and Water-Use Opposition
Average water use per Colorado tight-gas well quadrupled to 17.17 million gal in 2024, prompting permit pauses during low-reservoir months . New Mexico's Pecos River Compact restricts industrial withdrawal, capping large-scale completions below 15 wells per year. Recycled produced water now covers 65% of Permian fracture fluid but adds USD 0.50-0.80/bbl to cost. France and Germany still ban hydraulic fracturing, blocking roughly 15 Tcf of technically recoverable European tight gas . The U.K. lifted its moratorium in 2024, yet keeps a magnitude-0.5 threshold that has stalled new wells.
Other drivers and restraints analyzed in the detailed report include:
- Technology Cost Deflation
- Tight-Gas / CCS Integration Unlocking Green Finance
- Gas-price volatility vs LNG & shale
For complete list of drivers and restraints, kindly check the Table Of Contents.
Segment Analysis
Sandstone held 64.2% of the tight gas market share in 2025, anchored by Mesaverde and Haynesville outputs that benefit from natural fracture networks. The limestone market is projected to grow at an annual rate of 6.4% through 2031, surpassing sandstone, as advancements in acid-gel treatments enhance per-well productivity by approximately 30%. ADNOC's January 2026 SARB Deep Gas sanction underscores industry appetite for deep Khuff carbonates despite 4,500 m depths. Other resource types, such as tight coal-seam gas and hybrid shale-tight plays, significantly contributed to market revenue in 2025.
Cost curves vary sharply across rock types. Sandstone wells in the U.S. Mid-Continent drill for USD 6-8 million, while Middle East carbonate wells often exceed USD 15 million due to high-temp completions. Yet limestone offers steeper learning-curve gains; QatarEnergy lifted well productivity 22% in 2025 after switching to acid-gel systems. Australia balances coal-seam gas with tight imports to satisfy Queensland LNG, and hybrid Wolfcamp wells grant operators commodity optionality when oil-to-gas ratios widen. Overall, the tight gas market registers a gradual pivot toward carbonates outside North America, while sandstones remain dominant in U.S. basins.
Horizontal wells with multi-stage hydraulic fracturing accounted for 78.7% of 2025 revenue and are projected to expand at 6.1% through 2031. A Haynesville horizontal averages 25 MMcf/d initial output versus 1-2 MMcf/d for a vertical well, justifying the 3-4X capex premium. Conventional vertical wells persist in legacy fields where surface constraints discourage horizontals.
Asia-Pacific is accelerating adoption; Sinopec completed 85 horizontals at Fuling in 2025, and India's ONGC will drill 10 pilot wells by end-2026. In South America, YPF dropped vertical rigs to 15 in 2025 while boosting horizontals to 180, thanks to localized supply chains. Alberta's spacing rules still favor verticals in dense townships, demonstrating that regulation, geology, and surface rights collectively determine well-type mix within the tight gas market.
Geography Analysis
North America led the tight gas market with 45.3% share in 2025, producing 15 Bcf/d from the Permian and 12 Bcf/d from the Haynesville. Growth moderates to 5.2% as drilling migrates toward drier gas for LNG outlets. Canada's Montney and Duvernay flows benefited from the 2024 Coastal GasLink start-up, unlocking westward LNG pathways. Mexico's Burgos output stagnated as Pemex favored offshore conventional projects, leading U.S. pipeline imports to reach 6.8 Bcf/d.
Asia-Pacific posts the fastest 6.5% CAGR to 2031. CNPC expanded Ordos output by 5 bcm in 2025, and Sichuan exceeded 40 bcm/yr, displacing Beijing coal burn. India approved 12 GW of gas-peaking plants that will rely on Krishna-Godavari tight gas. Australia's Cooper Basin stayed flat as operators prioritized coal-seam gas while eyeing tight imports for LNG commitments.
Europe faces challenges due to the fracturing bans in Germany and France. While the United Kingdom has lifted its moratorium, seismic thresholds have hindered commercial operations. Equinor is advancing North Sea subsea tieback projects, and Gazprom's Achimov tight reserves continue to supply European pipelines, although sanctions have restricted technology inflow.
Growth in South America is primarily driven by Argentina's Vaca Muerta, where YPF plans to increase output to 60 MM m3/d by 2025 and has secured USD 3 billion in pipeline funding. Shell and Equinor have committed USD 2.5 billion to local tight gas projects, targeting LNG exports by 2029. Brazil is assessing the margins of the Santos Basin, while Bolivia has launched a USD 500 million Chaco program.
In the Middle East and Africa, ADNOC has approved the SARB Deep Gas project, targeting a plateau of 200 MMscf/d by 2029. QatarEnergy has allocated 40% of its USD 150 billion budget for 2026-2030 to unconventional gas development. Saudi Aramco's Jafurah pilot aims to achieve 2 Bcf/d by 2030. Meanwhile, South Africa's Karoo Basin faces delays due to environmental reviews and water scarcity issues.
- ExxonMobil Corporation
- Chevron Corporation
- Shell PLC
- bp p.l.c.
- TotalEnergies SE
- China National Petroleum Corp. (CNPC)
- ConocoPhillips
- Eni S.p.A.
- China Petroleum and Chemical Corporation
- Chesapeake Energy Corporation
- PetroChina Company Limited
- Equinor ASA
- Occidental Petroleum Corporation
- CNOOC Ltd
- Gazprom PJSC
- Woodside Energy Group Ltd
- QatarEnergy
- Repsol S.A.
- Ecopetrol S.A.
- Santos Limited
Additional Benefits:
- The market estimate (ME) sheet in Excel format
- 3 months of analyst support
TABLE OF CONTENTS
1 Introduction
- 1.1 Study Assumptions & Market Definition
- 1.2 Scope of the Study
2 Research Methodology
3 Executive Summary
4 Market Landscape
- 4.1 Market Overview
- 4.2 Market Drivers
- 4.2.1 Declining conventional gas reserves
- 4.2.2 Rising global gas-fired power demand
- 4.2.3 Technology cost deflation (HZ drilling & frac)
- 4.2.4 Government incentives to monetise stranded gas
- 4.2.5 Tight-gas/CCS integration unlocking green finance
- 4.2.6 National energy-security mandates boosting domestic output
- 4.3 Market Restraints
- 4.3.1 Environmental & water-use opposition
- 4.3.2 Gas-price volatility vs LNG & shale
- 4.3.3 Induced-seismicity moratoria in emerging plays
- 4.3.4 Proppant-supply bottlenecks in remote basins
- 4.4 Supply-Chain Analysis
- 4.5 Regulatory Landscape
- 4.6 Technological Outlook
- 4.7 Porter's Five Forces
- 4.7.1 Threat of New Entrants
- 4.7.2 Bargaining Power of Buyers
- 4.7.3 Bargaining Power of Suppliers
- 4.7.4 Threat of Substitutes
- 4.7.5 Competitive Rivalry
5 Market Size & Growth Forecasts
- 5.1 By Resource Type
- 5.1.1 Sandstone
- 5.1.2 Limestone
- 5.1.3 Others
- 5.2 By Well Type
- 5.2.1 Conventional
- 5.2.2 Unconventional
- 5.3 By Location
- 5.3.1 Offshore
- 5.3.2 Onshore
- 5.4 By End-user
- 5.4.1 Oil & Gas Majors
- 5.4.2 Utilities
- 5.4.3 Independent Producers
- 5.4.4 Government and NOCs
- 5.4.5 Others
- 5.5 By Geography
- 5.5.1 North America
- 5.5.1.1 United States
- 5.5.1.2 Canada
- 5.5.1.3 Mexico
- 5.5.2 Europe
- 5.5.2.1 Germany
- 5.5.2.2 United Kingdom
- 5.5.2.3 France
- 5.5.2.4 Italy
- 5.5.2.5 NORDIC Countries
- 5.5.2.6 Russia
- 5.5.2.7 Rest of Europe
- 5.5.3 Asia-Pacific
- 5.5.3.1 China
- 5.5.3.2 India
- 5.5.3.3 Japan
- 5.5.3.4 South Korea
- 5.5.3.5 ASEAN Countries
- 5.5.3.6 Rest of Asia-Pacific
- 5.5.4 South America
- 5.5.4.1 Brazil
- 5.5.4.2 Argentina
- 5.5.4.3 Rest of South America
- 5.5.5 Middle East and Africa
- 5.5.5.1 Saudi Arabia
- 5.5.5.2 United Arab Emirates
- 5.5.5.3 South Africa
- 5.5.5.4 Egypt
- 5.5.5.5 Rest of Middle East and Africa
- 5.5.1 North America
6 Competitive Landscape
- 6.1 Market Concentration
- 6.2 Strategic Moves (M&A, Partnerships, PPAs)
- 6.3 Market Share Analysis (Market Rank/Share for key companies)
- 6.4 Company Profiles (includes Global level Overview, Market level overview, Core Segments, Financials as available, Strategic Information, Products & Services, and Recent Developments)
- 6.4.1 ExxonMobil Corporation
- 6.4.2 Chevron Corporation
- 6.4.3 Shell PLC
- 6.4.4 bp p.l.c.
- 6.4.5 TotalEnergies SE
- 6.4.6 China National Petroleum Corp. (CNPC)
- 6.4.7 ConocoPhillips
- 6.4.8 Eni S.p.A.
- 6.4.9 China Petroleum and Chemical Corporation
- 6.4.10 Chesapeake Energy Corporation
- 6.4.11 PetroChina Company Limited
- 6.4.12 Equinor ASA
- 6.4.13 Occidental Petroleum Corporation
- 6.4.14 CNOOC Ltd
- 6.4.15 Gazprom PJSC
- 6.4.16 Woodside Energy Group Ltd
- 6.4.17 QatarEnergy
- 6.4.18 Repsol S.A.
- 6.4.19 Ecopetrol S.A.
- 6.4.20 Santos Limited
7 Market Opportunities & Future Outlook
- 7.1 White-space & Unmet-need Assessment

