
PUBLISHER: Mordor Intelligence | PRODUCT CODE: 2063240

PUBLISHER: Mordor Intelligence | PRODUCT CODE: 2063240
Energy Storage Battery For Microgrids - Market Share Analysis, Industry Trends & Statistics, Growth Forecasts (2026 - 2031)
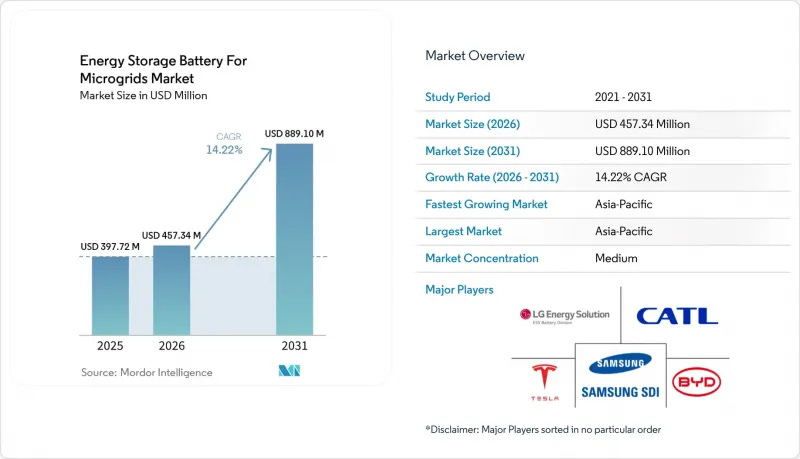
According to Mordor Intelligence, the energy storage battery for microgrids market size was valued at USD 397.72 million in 2025 and is estimated to grow from USD 457.34 million in 2026 to reach USD 889.10 million by 2031, at a CAGR of 14.22% during the forecast period (2026-2031).
This report is Segmented by Battery Chemistry (Lithium-Ion, Lead-Acid, Flow, and More), Power Rating (Below 100 KW, 100 To 500 KW, Above 500 KW), Microgrid Type (Remote/Islanded, Grid-Connected, Hybrid), End-User (Residential, and More), and Geography (North America, Europe, Asia-Pacific, South America, Middle East and Africa). The Market Forecasts are Provided in Terms of Value (USD).
Global Energy Storage Battery For Microgrids Market Trends and Insights
Falling Lithium-Ion Battery Pack Costs
Stationary storage pack prices dropped to USD 70 per kWh in 2025 after a surge in Chinese LFP output, compressing project paybacks from eight to five years and accelerating utility procurements. Nearly half of the cost decline stems from the substitution of cobalt-rich NMC cathodes with cobalt-free LFP, which also simplifies recycling. BloombergNEF estimates show price reductions moderating toward USD 60 per kWh by 2028 as cell-plant capex plateaus and raw-material logistics hit scale limits. Developers are responding with multi-year offtake contracts that hedge spot volatility and underwrite more aggressive bid prices in competitive tenders. Lower pack prices directly boost the Energy Storage Battery for Microgrids market by expanding the addressable base of projects that clear internal hurdle rates.
Rising Microgrid-Specific Incentives & Tariff Reforms
The United States' Inflation Reduction Act provides a 30% standalone storage tax credit, unlocking USD 2.1 billion in new projects across 18 states in 2025. California and New York layered performance-based tariffs on top, paying microgrids for grid services rather than kilowatt-hour throughput. India's 60% capital subsidy for rural microgrids spurred 1.2 GW of pipeline capacity by mid-2025. Tariff shifts in Hawaii and California reduced export credits by 40-75%, incentivizing self-consumption and lifting residential attachment rates. Collectively, these measures shave soft-cost risk, standardize interconnection, and add 2.8 % to the baseline CAGR for the Energy Storage Battery for Microgrids market.
Critical-Mineral Supply-Chain Volatility
Lithium carbonate spot prices swung 50% during 2025, peaking at USD 18,500 per metric ton in January before sliding to USD 9,200 by December, which forced battery makers to reopen contracts and delayed 8 GWh of planned microgrid capacity in North America and Europe. The Democratic Republic of Congo's artisanal-mining ban cut global cobalt supply by 12% and drove a 40% price jump for cobalt sulfate, adding unbudgeted augmentation costs for legacy NMC systems. Indonesia tightened nickel-ore export restrictions, stretching procurement cycles for high-nickel cathodes by up to nine months and disadvantaging suppliers without integrated refining. Vanadium pentoxide prices ranged between USD 8 and USD 14 per kilogram, preventing flow-battery vendors from locking in 25-year fixed-price bids that many utilities now demand. The International Energy Agency projects a 15% lithium-refining deficit by 2028, which could redirect material toward electric vehicles and compress Energy Storage Battery for Microgrids market growth by 2.1 % each year .
Other drivers and restraints analyzed in the detailed report include:
- Rapid Decline in LFP Cell Degradation Rates
- Open-Source Microgrid Controllers Enabling Standardisation
- Fire-Safety and Thermal-Runaway Concerns
For complete list of drivers and restraints, kindly check the Table Of Contents.
Segment Analysis
Lithium-ion technologies controlled 73.4% of the Energy Storage Battery for Microgrids market share in 2025, underpinned by proven supply chains and high-power capability. Sodium chemistries, however, are set to expand at 31.9% CAGR through 2031, the fastest pace among all options. CATL's USD 50 per kWh sodium-ion cells remove cobalt and nickel risk, redirecting cost savings toward balance-of-system upgrades. In Japan, sodium-sulfur systems meet 6-hour discharge needs within island grids, bridging the duration gap left by mainstream lithium products. Flow batteries occupy a niche in the market, offering long-duration energy storage with consistent performance over operating lifetimes exceeding 25 years and minimal capacity degradation.
Lead-acid batteries continue to support sub-50 kW rural microgrid projects due to their widespread familiarity in servicing and ease of repair. However, their shorter lifecycle performance limits their broader long-term adoption. Lithium titanate batteries remain primarily utilized in specialized transit and military applications, where ultra-long cycle life and high durability are prioritized over energy density. Alternative battery chemistries are expected to see steady adoption through 2031 as microgrid deployments expand across various use cases and operating conditions. Consequently, competitive positioning increasingly relies on aligning battery chemistry with specific application requirements rather than depending on a single dominant technology. Manufacturers with diversified chemistry portfolios are better equipped to address the evolving and fragmented demand landscape.
Systems above 500 kW held 55.1% of Energy Storage Battery for Microgrids market size in 2025 and exhibit a 15.2% CAGR through 2031, buoyed by utility procurements such as the 2.2 GWh Arizona Copia installation . Configurations in the 100-500 kW range constitute 28% of deployments, serving hospitals, data centers, and light-industrial loads that need two-to-three-hour back-up at manageable capex.
High balance-of-system costs still impede rural sub-100 kW roll-outs, although containerized kits from Schneider Electric cut installation time by 80% and shrink BOS premiums. IEEE 1547-2024 further accelerates 100-500 kW approvals by halving interconnection queues, pulling capital cycles forward. Utility-scale orders remain sticky because revenue stacking capacity payments, frequency response buffers margin risk. Conversely, small projects rely on donor finance and concessional loans, slowing scale. Suppliers that package standardized hardware plus remote monitoring stand to capture this underserved volume market.
Geography Analysis
North America held 34.7% of 2025 revenue. ERCOT's energy-only market and federal tax credits sustain a 13.8% regional CAGR despite growing interconnection backlogs. Texas and California each announced more than 1 GW of new projects after weather-driven outages. Canada's 80 MW Oneida installation exemplifies indigenous energy sovereignty plus grid-service monetization.
The Asia-Pacific region is expected to be the fastest-growing energy storage market, with a projected CAGR of 19.5% during the forecast period. This growth is driven by strong policy support, industrial decarbonization efforts, and grid modernization initiatives. In India, a 60% capital subsidy for battery energy storage projects has facilitated the development of approximately 1.2 GW of pipeline capacity, boosting deployment in both utility-scale and distributed applications. In China, the requirement for on-site microgrids in newly developed industrial parks has created an estimated 3 GW of additional energy storage demand. Japan is focusing on sodium-sulfur (NaS) battery systems to improve energy security and resilience, particularly for remote islands and disaster-prone areas. In Australia, the 500 MW Tomago Energy Hub project underscores the growing adoption of large-scale energy storage solutions by energy-intensive industries, further solidifying the region's position in advanced storage deployment and grid flexibility.
In Europe, Germany's hydrogen-battery hybrid at Energiepark Mainz validates multi-day balancing, yet permitting queues averaging 38 months suppresses market velocity. Nordic nations deploy microgrids for remote villages and data centers, whereas Spain and Italy struggle with legacy grid codes. South America, the Middle East, and Africa add opportunistic growth via mining corridors and solar campuses where grid extension is uneconomic.
- Tesla
- LG Energy Solution
- BYD
- Samsung SDI
- CATL
- Panasonic Energy
- Saft (TotalEnergies)
- Fluence Energy
- EnerSys
- Eos Energy Enterprises
- ESS Tech
- Kokam
- VARTA AG
- Leclanche
- Powin Energy
- NEC Energy Solutions
- NGK Insulators
- ZincFive
- Pylontech
- Primus Power
Additional Benefits:
- The market estimate (ME) sheet in Excel format
- 3 months of analyst support
TABLE OF CONTENTS
1 Introduction
- 1.1 Study Assumptions & Market Definition
- 1.2 Scope of the Study
2 Research Methodology
3 Executive Summary
4 Market Landscape
- 4.1 Market Overview
- 4.2 Market Drivers
- 4.2.1 Falling lithium-ion battery pack costs
- 4.2.2 Rising microgrid-specific incentives & tariff reforms
- 4.2.3 Growing demand for energy resilience in extreme-weather zones
- 4.2.4 Rapid decline in LFP cell degradation rates
- 4.2.5 Open-source microgrid controllers enabling standardisation
- 4.2.6 Emerging green-hydrogen hybrid microgrids
- 4.3 Market Restraints
- 4.3.1 Critical-mineral supply-chain volatility
- 4.3.2 Fire-safety & thermal-runaway concerns
- 4.3.3 High Balance of System (BOS) costs for less than 100 kW rural systems
- 4.3.4 Slow permitting in legacy grid codes
- 4.4 Supply-Chain Analysis
- 4.5 Regulatory Landscape
- 4.6 Technological Outlook
- 4.7 Porter's Five Forces Analysis
- 4.7.1 Threat of New Entrants
- 4.7.2 Bargaining Power of Suppliers
- 4.7.3 Bargaining Power of Buyers
- 4.7.4 Threat of Substitutes
- 4.7.5 Competitive Rivalry
5 Market Size & Growth Forecasts
- 5.1 By Battery Chemistry
- 5.1.1 Lithium-ion (NMC, LFP, LTO)
- 5.1.2 Lead-acid (VRLA, Flooded)
- 5.1.3 Flow (Vanadium, Zinc, Iron, Others)
- 5.1.4 Sodium-based (Na-ion, NaS)
- 5.1.5 Other Chemistries (NiCd, Zn-Br, etc.)
- 5.2 By Power Rating
- 5.2.1 Below 100 kW
- 5.2.2 100 to 500 kW
- 5.2.3 Above 500 kW
- 5.3 By Microgrid Type
- 5.3.1 Remote/Islanded
- 5.3.2 Grid-connected
- 5.3.3 Hybrid (PV-Diesel-Storage, etc.)
- 5.4 By End-user
- 5.4.1 Residential
- 5.4.2 Commercial and Industrial
- 5.4.3 Utility
- 5.5 By Region
- 5.5.1 North America
- 5.5.1.1 United States
- 5.5.1.2 Canada
- 5.5.1.3 Mexico
- 5.5.2 Europe
- 5.5.2.1 United Kingdom
- 5.5.2.2 Germany
- 5.5.2.3 France
- 5.5.2.4 Spain
- 5.5.2.5 Nordic Countries
- 5.5.2.6 Russia
- 5.5.2.7 Rest of Europe
- 5.5.3 Asia-Pacific
- 5.5.3.1 China
- 5.5.3.2 India
- 5.5.3.3 Japan
- 5.5.3.4 South Korea
- 5.5.3.5 ASEAN Countries
- 5.5.3.6 Australia and New Zealand
- 5.5.3.7 Rest of Asia-Pacific
- 5.5.4 South America
- 5.5.4.1 Brazil
- 5.5.4.2 Argentina
- 5.5.4.3 Colombia
- 5.5.4.4 Rest of South America
- 5.5.5 Middle East and Africa
- 5.5.5.1 United Arab Emirates
- 5.5.5.2 Saudi Arabia
- 5.5.5.3 South Africa
- 5.5.5.4 Egypt
- 5.5.5.5 Rest of Middle East and Africa
- 5.5.1 North America
6 Competitive Landscape
- 6.1 Market Concentration
- 6.2 Strategic Moves (M&A, Partnerships, PPAs)
- 6.3 Market Share Analysis (Market Rank/Share for key companies)
- 6.4 Company Profiles (includes Global level Overview, Market level overview, Core Segments, Financials as available, Strategic Information, Products & Services, and Recent Developments)
- 6.4.1 Tesla
- 6.4.2 LG Energy Solution
- 6.4.3 BYD
- 6.4.4 Samsung SDI
- 6.4.5 CATL
- 6.4.6 Panasonic Energy
- 6.4.7 Saft (TotalEnergies)
- 6.4.8 Fluence Energy
- 6.4.9 EnerSys
- 6.4.10 Eos Energy Enterprises
- 6.4.11 ESS Tech
- 6.4.12 Kokam
- 6.4.13 VARTA AG
- 6.4.14 Leclanche
- 6.4.15 Powin Energy
- 6.4.16 NEC Energy Solutions
- 6.4.17 NGK Insulators
- 6.4.18 ZincFive
- 6.4.19 Pylontech
- 6.4.20 Primus Power
7 Market Opportunities & Future Outlook
- 7.1 White-space & Unmet-Need Assessment

