
PUBLISHER: Mordor Intelligence | PRODUCT CODE: 2063241

PUBLISHER: Mordor Intelligence | PRODUCT CODE: 2063241
Solar PV Testing Equipment - Market Share Analysis, Industry Trends & Statistics, Growth Forecasts (2026 - 2031)
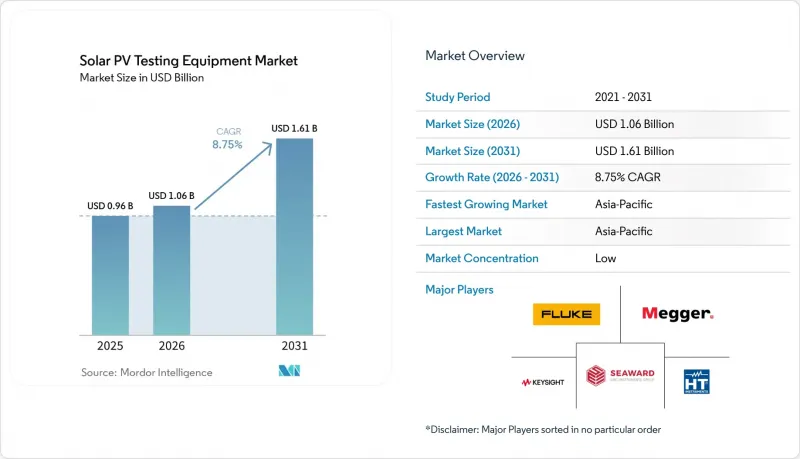
According to Mordor Intelligence, the solar pV testing equipment market size is expected to grow from USD 0.96 billion in 2025 to USD 1.06 billion in 2026 and is forecast to reach USD 1.61 billion by 2031 at 8.75% CAGR over 2026-2031.
This report is Segmented by Equipment Type (Power Analyzers, IV Curve Tracers, and More), Technology (Automated, and More), Testing Phase (Pre-Installation, On-Site, Maintenance), Application (Manufacturers, and More), End-User (Energy, Manufacturing, and More), and Geography (North America, Europe, Asia-Pacific, South America, Middle East and Africa). Market Forecasts are Provided in Value (USD).
Global Solar PV Testing Equipment Market Trends and Insights
Escalating Global PV Installation Volumes
World solar additions hit 601 GW in 2024, lifting cumulative installations above 2.26 TW and generating a sizable backlog of arrays awaiting grid-connection testing. Asia-Pacific contributed roughly 71% of those megawatts, with China alone commissioning 357 GW, which in turn elongates factory and field-testing queues. Because commissioning happens after mechanical completion, Solar PV Testing Equipment Market revenues typically trail capacity additions by six to twelve months, smoothing topline volatility. The steep rise of bifacial modules, now more than three-quarters of shipments, necessitates rear-irradiance sensors unavailable in single-plane testers, pushing EPCs toward fleet upgrades. As a result, distributors report that back-orders for 1,500 V IV curve tracers now stretch eight weeks, double the 2023 lead time, underscoring demand tightness.
Rapid Cost Decline of PV Hardware & O&M Digitalization
Module prices across Europe averaged EUR 0.20 per watt in Q4 2024, compressing hardware capex and elevating commissioning to 3-5% of total installed cost. Developers, therefore, treat testing as yield insurance: missed hotspots can lower annual performance ratios by 200-300 basis points, pushing IRRs below debt covenants. Cloud-ready analyzers that autopopulate asset-management portals attract 20-30% price premiums yet remain attractive above 500 MW portfolio scale, where manual data entry becomes cost-prohibitive. Lower hardware costs thus paradoxically raise per-watt spending on high-precision testers, a tailwind for premium suppliers. This digital shift simultaneously unlocks subscription revenue models, cushioning vendors against cyclical hardware demand.
High CAPEX for Advanced Testing Equipment
Fully automated rigs able to execute all IEC 62446-1 checks across 1,500 V strings cost USD 50,000-80,000, a figure that eclipses the annual revenue of small installers in Egypt, Indonesia, and Argentina. European and U.S. EPCs amortize such gear over portfolios surpassing 200 MW, but contractors in developing regions rely on handheld meters and thermal cameras that insurers may reject. Leasing solutions remain scarce where banks lack familiarity with residual equipment values, deepening the affordability gap. Service companies are stepping in with rental fleets, charging USD 500-1,500 per MW for on-demand commissioning, thus broadening market reach without requiring end-user capex.
Other drivers and restraints analyzed in the detailed report include:
- Evolving Safety-Compliance Standards
- Shift to 1,500 V String Architectures
- Shortage of Certified PV Test Technicians in Emerging Markets
For complete list of drivers and restraints, kindly check the Table Of Contents.
Segment Analysis
Power analyzers contributed 35.3% of the Solar PV Testing Equipment market revenue in 2025, reflecting their multipurpose roles in inverter efficiency, harmonic distortion, and grid-compliance verification. IV curve tracers, however, are forecast to post the fastest 9.4% CAGR through 2031 as developers elevate string-level diagnostics to preempt soiling-induced hotspots that can breach insurers' 80% performance-ratio thresholds. Drone-borne thermal imagers scan up to 100 MW per day, outperforming ground crews by a factor of ten, yet aviation restrictions near airports preserve a niche for handheld cameras. Integrated testers that merge IV tracing, insulation resistance, and infrared imaging in one chassis reduce commissioning labor by 30%, positioning that category as an attractive upgrade pathway.
Second-generation tracers rated for 1,500 V now dominate bid documents across India and the Middle East, while 2,000 V-capable prototypes entered field trials in 2025. As a result, the Solar PV Testing Equipment Market expects a mid-cycle replacement bump in 2028 when early 1,500 V fleets require recalibration. Thermal imagers still underpin maintenance programs for projects commissioned before 2015, whose encapsulant layers are entering accelerated degradation phases invisible to electrical tests. Meanwhile, solar simulators remain confined to factory quality-control and research labs.
Manual devices retained 46.1% share of the Solar PV Testing Equipment Market in 2025, a legacy of multimeters purchased before stringent modern standards. Automated platforms, though, will expand at 10.2% CAGR as labor scarcities push contractors toward capital solutions. Cloud-enabled analyzers streamline report generation for asset managers overseeing portfolios beyond 500 MW, where data-entry savings outweigh hardware premiums. Portable designs powered by lithium-ion packs achieve eight-hour runtimes, eliminating generator needs at remote desert sites and cutting logistics costs.
Yet full autonomy faces regulatory friction: underwriters still mandate expert review of raw IV curves, capping labor displacement. Hybrid systems, such as programmable DC supplies that auto-sequence grid-fault tests but require technician countersignature, typify interim adoption patterns. Retrofit Bluetooth modules that add automated logging to legacy testers cost under USD 1,200, appealing to small-scale installers and extending product life cycles. Consequently, the Solar PV Testing Equipment industry balances innovation with backward compatibility to sustain installed-base relevance.
Geography Analysis
Europe captured 32.5% of the Solar PV Testing Equipment market revenue in 2025, underpinned by rigid compliance frameworks and a leap in bifacial-module penetration from 17% to 74% of German installs during 2024. New European Union funding, via the CINEA-backed ECODESIGN PV TESTING project, signals imminent tightening of standards for rear-side irradiance verification, likely triggering another mid-decade purchasing surge. However, permitting timelines stretching beyond four years in some member states delays tester procurements until grid-connection certificates are certain, injecting episodic demand lumps.
Asia-Pacific is the fastest-growing region, set to rise at 10.4% CAGR through 2031. China's distributed PV stock exceeded 508 GW by September 2025 and is governed by the "four-abilities" rule requiring analyzers to validate self-healing and interaction functions. India's 31.9 GW of 2024 additions, alongside its production-linked incentive for module manufacturing, feed parallel demand for factory-floor testers. Technician shortages across Southeast Asia temper uptake of fully automated systems, leading contractors to favor rugged manual tools backed by regional calibration labs.
North America installed 47 GW in 2024, yet interconnection queues surpassing 2 TW postpone notice-to-proceed milestones, deferring tester purchases. Nevertheless, the Inflation Reduction Act's long-dated tax credits underpin a robust pipeline that will convert to equipment orders as grid upgrades unlock capacity. The Middle East accelerates with gigawatt-scale tenders in Saudi Arabia and the UAE, adopting 1,500-V strings, demanding high-voltage certification equipment. Africa and South America grapple with financing headwinds, but rental models for portable testers lower adoption barriers for small-scale installers.
- Fluke Corporation (incl. Solmetric)
- Seaward Electronic Ltd.
- HT Instruments (HT-Italia)
- Chauvin Arnoux Group
- Megger Group
- Kyoritsu Electrical Instruments Works Ltd.
- Gossen Metrawatt GmbH
- MECO Instruments
- Metrel d.d.
- Keysight Technologies
- Yokogawa Electric Corporation
- Chroma ATE Inc.
- Newport Corporation (MKS Instruments)
- PV Measurements Inc.
- EKO Instruments
- OTT HydroMet(Kipp & Zonen)
- Sevensense
- Apogee Instruments
- Delta OHM
- AMETEK / Abet Technologies
- AEMC Instruments
- PV-One (IVy)
- CMW Solar
- Eltest Engineering
Additional Benefits:
- The market estimate (ME) sheet in Excel format
- 3 months of analyst support
TABLE OF CONTENTS
1 Introduction
- 1.1 Study Assumptions & Market Definition
- 1.2 Scope of the Study
2 Research Methodology
3 Executive Summary
4 Market Landscape
- 4.1 Market Overview
- 4.2 Market Drivers
- 4.2.1 Escalating global PV installation volumes
- 4.2.2 Rapid cost decline of PV hardware & O&M digitalization
- 4.2.3 Evolving safety-compliance standards (IEC 62446-1, NEC 2023)
- 4.2.4 Shift to 1,500 V string architectures needing high-voltage testers
- 4.2.5 ESG-driven zero-defect procurement policies by asset owners
- 4.2.6 Insurance underwriters mandating baseline performance data
- 4.3 Market Restraints
- 4.3.1 High CAPEX for advanced testing equipment
- 4.3.2 Shortage of certified PV test technicians in emerging markets
- 4.3.3 Smart inverters' built-in self-diagnostics curbing external tester demand
- 4.3.4 Cyber-security concerns over cloud-connected test gear
- 4.4 Supply-Chain Analysis
- 4.5 Regulatory Landscape
- 4.6 Technological Outlook
- 4.7 Porter's Five Forces Analysis
- 4.7.1 Threat of New Entrants
- 4.7.2 Bargaining Power of Buyers
- 4.7.3 Bargaining Power of Suppliers
- 4.7.4 Threat of Substitutes
- 4.7.5 Competitive Rivalry
5 Market Size & Growth Forecasts
- 5.1 By Equipment Type
- 5.1.1 Power Analyzers
- 5.1.2 IV Curve Tracers
- 5.1.3 Thermal Imagers
- 5.1.4 Solar Simulators
- 5.1.5 Multimeters
- 5.1.6 Shunt Resistors
- 5.2 By Technology
- 5.2.1 Automated Testing Equipment
- 5.2.2 Manual Testing Equipment
- 5.2.3 Portable Testing Equipment
- 5.2.4 Integrated Testing Systems
- 5.3 By Testing Phase
- 5.3.1 Pre-Installation Testing
- 5.3.2 On-Site Testing
- 5.3.3 Maintenance Testing
- 5.4 By Application
- 5.4.1 Solar Panel Manufacturers
- 5.4.2 Solar System Installers
- 5.4.3 Solar Farms and Utility-Scale Installations
- 5.4.4 Research and Development
- 5.4.5 Maintenance and Repair Services
- 5.5 By End-User Industry
- 5.5.1 Energy and Power
- 5.5.2 Manufacturing
- 5.5.3 Construction and Infrastructure
- 5.5.4 Government and Public Sector
- 5.5.5 Research Institutions
- 5.6 By Geography
- 5.6.1 North America
- 5.6.1.1 United States
- 5.6.1.2 Canada
- 5.6.1.3 Mexico
- 5.6.2 Europe
- 5.6.2.1 Germany
- 5.6.2.2 United Kingdom
- 5.6.2.3 France
- 5.6.2.4 Italy
- 5.6.2.5 NORDIC Countries
- 5.6.2.6 Russia
- 5.6.2.7 Rest of Europe
- 5.6.3 Asia-Pacific
- 5.6.3.1 China
- 5.6.3.2 India
- 5.6.3.3 Japan
- 5.6.3.4 South Korea
- 5.6.3.5 ASEAN Countries
- 5.6.3.6 Rest of Asia-Pacific
- 5.6.4 South America
- 5.6.4.1 Brazil
- 5.6.4.2 Argentina
- 5.6.4.3 Rest of South America
- 5.6.5 Middle East and Africa
- 5.6.5.1 Saudi Arabia
- 5.6.5.2 United Arab Emirates
- 5.6.5.3 South Africa
- 5.6.5.4 Egypt
- 5.6.5.5 Rest of Middle East and Africa
- 5.6.1 North America
6 Competitive Landscape
- 6.1 Market Concentration
- 6.2 Strategic Moves (M&A, Partnerships, PPAs)
- 6.3 Market Share Analysis (Market Rank/Share for key companies)
- 6.4 Company Profiles (includes Global level Overview, Market level overview, Core Segments, Financials as available, Strategic Information, Products & Services, and Recent Developments)
- 6.4.1 Fluke Corporation (incl. Solmetric)
- 6.4.2 Seaward Electronic Ltd.
- 6.4.3 HT Instruments (HT-Italia)
- 6.4.4 Chauvin Arnoux Group
- 6.4.5 Megger Group
- 6.4.6 Kyoritsu Electrical Instruments Works Ltd.
- 6.4.7 Gossen Metrawatt GmbH
- 6.4.8 MECO Instruments
- 6.4.9 Metrel d.d.
- 6.4.10 Keysight Technologies
- 6.4.11 Yokogawa Electric Corporation
- 6.4.12 Chroma ATE Inc.
- 6.4.13 Newport Corporation (MKS Instruments)
- 6.4.14 PV Measurements Inc.
- 6.4.15 EKO Instruments
- 6.4.16 OTT HydroMet(Kipp & Zonen)
- 6.4.17 Sevensense
- 6.4.18 Apogee Instruments
- 6.4.19 Delta OHM
- 6.4.20 AMETEK / Abet Technologies
- 6.4.21 AEMC Instruments
- 6.4.22 PV-One (IVy)
- 6.4.23 CMW Solar
- 6.4.24 Eltest Engineering
7 Market Opportunities & Future Outlook
- 7.1 White-space & Unmet-need Assessment

