
PUBLISHER: Mordor Intelligence | PRODUCT CODE: 2063248

PUBLISHER: Mordor Intelligence | PRODUCT CODE: 2063248
Advanced Energy Storage Systems - Market Share Analysis, Industry Trends & Statistics, Growth Forecasts (2026 - 2031)
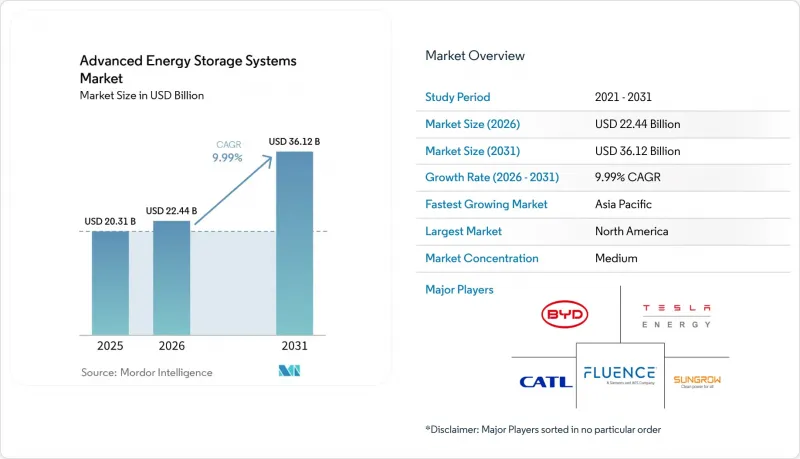
According to Mordor Intelligence, the advanced energy storage systems market size is expected to increase from USD 20.31 billion in 2025 to USD 22.44 billion in 2026 and reach USD 36.12 billion by 2031, growing at a CAGR of 9.99% over 2026-2031.
This report is Segmented by Type (Electrochemical Storage, Thermal Energy Storage, Mechanical Storage, Others), Application (Grid Storage, Renewable Integration, and More), End-User (Utilities, Commercial and Industrial, and More), and Geography (North America, Europe, Asia-Pacific, South America, and Middle East and Africa). The Market Forecasts are Provided in Terms of Value (USD).
Global Advanced Energy Storage Systems Market Trends and Insights
Rapid Decline in Lithium-Ion Battery USD /kWh
Average lithium-ion pack prices fell to USD 108 per kWh in 2025 and are projected at USD 105 per kWh in 2026, while large utility procurements already secure sub-USD 70 per kWh pricing at the pack level. Cathode shifts toward lithium iron phosphate have removed cobalt exposure and improved cycle life, letting 4-hour projects clear merchant arbitrage markets without subsidies. Scale advantages at CATL's Ningde base produced 69 GWh in 2024, setting a volume benchmark competitors must match. The cost curve is flattening, and future savings hinge on solid-state or sodium-ion breakthroughs that are in the pilot stage. Cell maker, therefore, integrates downstream to secure margin, pressuring pure-play integrators to focus on software value.
Global Clean-Energy Mandates & Storage Procurement Targets
Extension of the U.S. investment tax credit through 2032 combines with state targets such as California's 16.9 GW requirement and New Jersey's 2 GW goal, generating a visible pipeline that derisks finance. Europe's REPowerEU includes Germany's 17.5 GW and the UK's 50 GW ambitions, while China demands storage equal to up to 20% of renewable nameplate capacity. These mandates embed batteries into every new solar and wind business case and push developers to preorder systems 18-24 months ahead, tightening supply chains. IEC 62933 performance standards and ISO 22600 safety protocols are becoming universal bid prerequisites, formalizing quality thresholds.
Critical-Mineral Price & Supply Volatility
Cobalt jumped 240% in 2025 after export quotas in the Democratic Republic of Congo cut shipments, while lithium carbonate swung between USD 12 000 and USD 28 000 per metric ton on Chinese demand uncertainty. Nickel saw the opposite trend as Indonesian output depressed prices, threatening future supply if high-cost mines stay idle. Battery makers respond with lithium iron phosphate adoption, which removes cobalt and nickel risk but introduces phosphate dependencies. Multi-year offtake contracts and upstream joint ventures are now standard, favoring vertically integrated giants that can prepay mines for security of supply.
Other drivers and restraints analyzed in the detailed report include:
- Revenue Stacking in Ancillary-Service Markets
- EV-Scale Manufacturing Lowering Stationary Costs
- Thermal-Run-Away & Fire-Safety Compliance Costs
For complete list of drivers and restraints, kindly check the Table Of Contents.
Segment Analysis
Electrochemical systems held 57.9% of the advanced energy storage systems market share in 2025, supported by lithium iron phosphate cells priced near USD 105 per kWh and life cycles beyond 8 000 cycles. The advanced energy storage systems market size attached to electrochemical chemistries, therefore, scales fastest where a four-hour duration can clear merchant spreads. Flow batteries and sodium-sulfur solutions address 6-10-hour windows, yet high temperature or vanadium costs confine uptake to niches. Over the forecast, incremental cost declines and standardized containers will let electrochemical portfolios expand into critical-peak applications, although long-duration roles increasingly migrate to chemical or mechanical formats.
Chemical pathways grow at a 13.3% CAGR as green hydrogen and synthetic fuels become grid-stability backstops rather than marginal peak shavers. Mitsubishi Power's 317 MW Utah project blends cavern storage with 220 MW of electrolyzers, proving that multiday discharge can reach IRRs competitive with peaking gas. Thermal and mechanical variants, from molten-salt tanks to compressed-air caverns, remain constrained by site geology and permitting but fetch lower USD-per-kWh numbers for eight-hour-plus applications, ensuring a diversified mix within the advanced energy storage systems market.
Geography Analysis
Asia-Pacific captured 46.2% revenue in 2025, underpinned by China's vertically integrated value chain, where CATL, BYD, and EVE Energy collectively surpassed 300 GWh of annual output. Provincial mandates that every renewable plant include 15-20% storage create recurring demand, and mega projects such as Shandong's 3.5 GW installation demonstrate execution at scale. Japan pursues sodium-sulfur for long-duration resilience, and India's PLI scheme funds gigafactories that will feed Southeast Asian pipelines, ensuring the advanced energy storage systems market remains anchored in the region.
North America grows at 14.5% CAGR on the back of Inflation Reduction Act tax credits and domestic content bonuses that tilt procurement toward local manufacturing, including Tesla's 40 GWh Megapack line and LG's Arizona expansion. ERCOT overtook California in yearly additions during 2025 as performance-based ancillary prices reward sub-second response assets. Canada and Mexico follow with policy-backed auctions targeting renewable firming.
Europe's 50 GW UK goal, 17.5 GW German target, and made-in-EU procurement thresholds force developers to balance supply security with 15-20% higher capex linked to local assembly. Nordic pumped hydro provides seasonal balancing, while Eastern Europe eyes lithium storage to stabilize growing solar pipelines. South America readies its first large tenders in Brazil and Argentina, banking on hybrid solar-storage to curb curtailment. The Middle East and Africa accelerate as Saudi Arabia grid-connected 7.8 GWh of batteries in January 2026, setting a regional record
- Tesla, Inc.
- Siemens AG
- LG Energy Solution
- Fluence Energy, Inc.
- Samsung SDI Co., Ltd.
- General Electric Company
- BYD Company Ltd.
- Hitachi Energy
- Panasonic Holdings Corporation
- Saft Groupe S.A.
- VARTA AG
- Mitsubishi Power
- NGK Insulators, Ltd.
- ESS Inc.
- EnerSys
- Hydrostor Inc.
- Ambri Inc.
- Invinity Energy Systems
- Energy Vault Holdings, Inc.
- Stryten Energy
- Contemporary Amperex Technology Co. Ltd. (CATL)
- Sungrow Power Supply Co., Ltd.
- EVE Energy Co., Ltd.
- HyperStrong Technology
- CRRC Zhuzhou Institute
Additional Benefits:
- The market estimate (ME) sheet in Excel format
- 3 months of analyst support
TABLE OF CONTENTS
1 Introduction
- 1.1 Study Assumptions & Market Definition
- 1.2 Scope of the Study
2 Research Methodology
3 Executive Summary
4 Market Landscape
- 4.1 Market Overview
- 4.2 Market Drivers
- 4.2.1 Rapid decline in lithium-ion battery $/kWh
- 4.2.2 Global clean-energy mandates & storage procurement targets
- 4.2.3 Revenue stacking in ancillary-service markets
- 4.2.4 EV-scale manufacturing lowering stationary costs
- 4.2.5 Second-life EV packs opening low-CAPEX markets
- 4.2.6 AI-driven dispatch boosting project IRRs
- 4.3 Market Restraints
- 4.3.1 Critical-mineral price & supply volatility
- 4.3.2 Thermal-run-away & fire-safety compliance costs
- 4.3.3 US/EU trade barriers & local-content mandates
- 4.3.4 Competition from non-battery long-duration storage
- 4.4 Supply-Chain Analysis
- 4.5 Regulatory Landscape
- 4.6 Technological Outlook
- 4.7 Porter's Five Forces
- 4.7.1 Threat of New Entrants
- 4.7.2 Bargaining Power of Buyers
- 4.7.3 Bargaining Power of Suppliers
- 4.7.4 Threat of Substitutes
- 4.7.5 Competitive Rivalry
5 Market Size & Growth Forecasts
- 5.1 By Type
- 5.1.1 Electrochemical Storage
- 5.1.1.1 Lithium-ion Batteries
- 5.1.1.2 Sodium-Sulfur Batteries
- 5.1.1.3 Flow Batteries
- 5.1.1.4 Lead-acid Batteries
- 5.1.1.5 Nickel-based Batteries
- 5.1.2 Thermal Energy Storage
- 5.1.2.1 Sensible Heat
- 5.1.2.2 Latent Heat
- 5.1.2.3 Thermochemical
- 5.1.3 Mechanical Storage
- 5.1.3.1 Pumped Hydro Storage
- 5.1.3.2 Compressed-Air (CAES)
- 5.1.3.3 Flywheel Storage
- 5.1.4 Chemical Storage
- 5.1.4.1 Hydrogen
- 5.1.4.2 Synthetic Natural Gas
- 5.1.4.3 Ammonia
- 5.1.5 Hybrid Storage Systems
- 5.1.1 Electrochemical Storage
- 5.2 By Application
- 5.2.1 Grid Storage
- 5.2.2 Renewable Integration
- 5.2.3 Backup Power Systems
- 5.2.4 Electric-Vehicle Infrastructure
- 5.2.5 Industrial Energy Management
- 5.2.6 Off-grid and Remote Area Storage
- 5.2.7 Residential Storage
- 5.3 By End-user
- 5.3.1 Utilities
- 5.3.2 Commercial and Industrial
- 5.3.3 Residential
- 5.4 By Geography
- 5.4.1 North America
- 5.4.1.1 United States
- 5.4.1.2 Canada
- 5.4.1.3 Mexico
- 5.4.2 Europe
- 5.4.2.1 Germany
- 5.4.2.2 United Kingdom
- 5.4.2.3 France
- 5.4.2.4 Italy
- 5.4.2.5 NORDIC Countries
- 5.4.2.6 Russia
- 5.4.2.7 Rest of Europe
- 5.4.3 Asia-Pacific
- 5.4.3.1 China
- 5.4.3.2 India
- 5.4.3.3 Japan
- 5.4.3.4 South Korea
- 5.4.3.5 ASEAN Countries
- 5.4.3.6 Rest of Asia-Pacific
- 5.4.4 South America
- 5.4.4.1 Brazil
- 5.4.4.2 Argentina
- 5.4.4.3 Rest of South America
- 5.4.5 Middle East and Africa
- 5.4.5.1 Saudi Arabia
- 5.4.5.2 United Arab Emirates
- 5.4.5.3 South Africa
- 5.4.5.4 Egypt
- 5.4.5.5 Rest of Middle East and Africa
- 5.4.1 North America
6 Competitive Landscape
- 6.1 Market Concentration
- 6.2 Strategic Moves (M&A, Partnerships, PPAs)
- 6.3 Market Share Analysis (Market Rank/Share for key companies)
- 6.4 Company Profiles (includes Global level Overview, Market level overview, Core Segments, Financials as available, Strategic Information, Products & Services, and Recent Developments)
- 6.4.1 Tesla, Inc.
- 6.4.2 Siemens AG
- 6.4.3 LG Energy Solution
- 6.4.4 Fluence Energy, Inc.
- 6.4.5 Samsung SDI Co., Ltd.
- 6.4.6 General Electric Company
- 6.4.7 BYD Company Ltd.
- 6.4.8 Hitachi Energy
- 6.4.9 Panasonic Holdings Corporation
- 6.4.10 Saft Groupe S.A.
- 6.4.11 VARTA AG
- 6.4.12 Mitsubishi Power
- 6.4.13 NGK Insulators, Ltd.
- 6.4.14 ESS Inc.
- 6.4.15 EnerSys
- 6.4.16 Hydrostor Inc.
- 6.4.17 Ambri Inc.
- 6.4.18 Invinity Energy Systems
- 6.4.19 Energy Vault Holdings, Inc.
- 6.4.20 Stryten Energy
- 6.4.21 Contemporary Amperex Technology Co. Ltd. (CATL)
- 6.4.22 Sungrow Power Supply Co., Ltd.
- 6.4.23 EVE Energy Co., Ltd.
- 6.4.24 HyperStrong Technology
- 6.4.25 CRRC Zhuzhou Institute
7 Market Opportunities & Future Outlook
- 7.1 White-space & Unmet-Need Assessment

