
PUBLISHER: Mordor Intelligence | PRODUCT CODE: 2063382

PUBLISHER: Mordor Intelligence | PRODUCT CODE: 2063382
Textile - Market Share Analysis, Industry Trends & Statistics, Growth Forecasts (2026 - 2031)
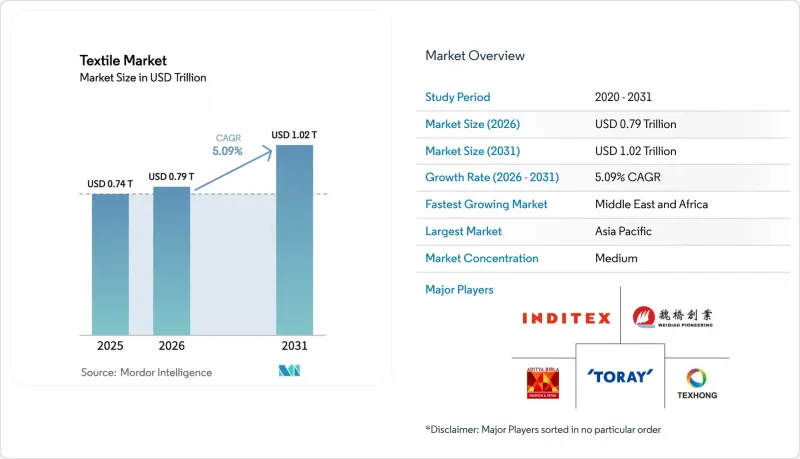
According to Mordor Intelligence, the textile market size is projected to expand from USD 0.74 trillion in 2025 and USD 0.79 trillion in 2026 to USD 1.02 trillion by 2031, registering a CAGR of 5.09% between 2026 to 2031.
This report is Segmented by Application (Fashion and Apparel, Industrial/Technical Textiles, Household and Home Textiles and More), Raw Material (Natural Fibers (Cotton, Wool, and More), Synthetic Fibers (Polyester, Nylon, and More), and More), Process/Technology (Woven, Knitted, Non-Woven, and More), and Geography (North America, Asia-Pacific, and More). The Market Forecasts are Provided in Terms of Value (USD).
Global Textile Market Trends and Insights
EU Digital Product Passport Accelerating Traceability Technology Investments
The EU Digital Product Passport requires every textile sold in the bloc to carry machine-readable data on origin, composition, and end-of-life pathways by 2027, spurring USD 1.45 billion in combined software and hardware spend among European mills. Bangladeshi and Vietnamese exporters are mirroring the upgrades to keep EU access, effectively globalizing the standard. Interoperability gaps between enterprise software vendors raise switching costs for small mills and could trigger consolidation among sub-scale operators. Verified composition data also unlocks secondary-raw-material marketplaces, bolstering recycling economics. As pilot projects mature, brands anticipate 20% faster supplier-auditing cycles, freeing working capital for design and marketing.
Uyghur Forced Labor Prevention Act Shifting Sourcing Toward Certified Non-Xinjiang Cotton
Aggressive enforcement of the UFLPA led to a 20% drop in U.S. cotton-apparel imports from China between 2022 and 2025, diverting orders to India and Vietnam. Stable-isotope testing has scaled quickly, with laboratories processing more than 10,000 samples in 2024, underpinning credible provenance claims. Indian spinners handled a 35% hike in U.S. orders during 2024, demonstrating how compliance mandates reshape global flows. Retailers now budget 2% - 4% of landed cost for documentation, a margin drag that accelerates digital-traceability adoption. The re-routing of contracts stabilizes rural incomes in alternative sourcing nations and cements long-run demand for certified sustainable cotton.
Red Sea Shipping Disruptions Inflating Freight Costs for Asia-to-EU Trade Lanes
Rerouting around the Cape of Good Hope adds 10-14 days transit and up to USD 100,000 per 25-FEU order. Working-capital cycles lengthen, forcing earlier order placement and eroding fast-fashion responsiveness. Spot rates eased mid-2025, but forwarders price a persistent risk premium. Near-shoring gains momentum; Turkish and Moroccan mills that deliver within a week pick up share, even at 10%-plus higher FOB prices. Brands re-evaluate free-on-board terms, seeking dual-source strategies to hedge corridor risk.
Other drivers and restraints analyzed in the detailed report include:
- AI-driven on-demand manufacturing reducing inventory waste
- Carbon-Credit Monetization Programs Boosting Recycled-Fiber Profitability
- Escalating Renewable-Energy Surcharges Raising Electricity Costs
For complete list of drivers and restraints, kindly check the Table Of Contents.
Segment Analysis
Fashion & Apparel commanded 56.06% of the 2025 demand, underscoring consumer dominance within the textile industry. Yet Industrial/Technical Textiles are growing at a 6.15% CAGR, the fastest pace across applications, as performance criteria in automotive, medical, and construction projects trump aesthetic drivers. Automotive airbag, seatbelt, and interior-trim fabrics now fetch 30% price premiums, supported by electric-vehicle lightweighting targets. Medical disposables maintain double-digit growth, buoyed by aging populations and entrenched infection-control standards. Protective workwear sales rise on stricter flame-resistance codes in energy and utilities, while sports fabric innovators integrate phase-change materials to command USD 10 premiums per garment.
Automotive lightweighting extends the textile industry share for high-tenacity polyester yarns, and hospital demand anchors volumes in non-woven gowns and drapes. Household & Home textiles grow modestly at 3%-4%, limited by mature replacement cycles. Sports-performance niches exploit moisture management and thermoregulation to sustain premium pricing. As sustainability pressure mounts, brands blend aesthetic appeal with certified functionality, solidifying technical segments as a structural growth engine for the textile industry.
Geography Analysis
Asia-Pacific retained 54.06% of 2025 output, anchored by integrated Chinese clusters that compress lead times and by Bangladesh's low labor costs. Vietnam captured diverted U.S. orders under the UFLPA, posting 18% year-on-year export growth in H1 2025, while India's Production-Linked Incentive scheme drove a 9% climb in textile shipments, reinforcing its China-plus-one appeal. The Middle East & Africa is the fastest-growing region at a 5.80% CAGR, propelled by Egypt's EU trade perks and Saudi Arabia's USD 1.32 billion polyester investments that extend petrochemical value chains into fiber.
Europe, representing almost one-fifth of demand, pivots to high-value technical textiles as the Carbon Border Adjustment Mechanism raises import costs for carbon-heavy Asian products. German and Italian mills channel R&D into medical and automotive fabrics, capturing resilient margins even as mass-market apparel relocates. North America rides a reshoring wave in non-wovens and technical fabrics, with southeastern U.S. states attracting USD 400 million in capacity expansions that prioritize supply-chain resilience. South America, led by Brazil and Peru, posts steady 3%-4% gains but remains hindered by logistics bottlenecks that inflate delivered costs.
Turkey and Morocco benefit from Red Sea shipping disruptions, offering 5-to-7-day delivery windows into European DCs. South African mills leverage the AfCFTA to sell into Nigeria and Kenya, reversing a decade-long import tide. Energy-cost differentials and regulatory alignment with EU traceability rules will continue to re-order the geography of the textile industry through 2031.
- Toray Industries Inc.
- Weiqiao Pioneering Group Co. Ltd.
- Texhong Textile Group Ltd.
- Inditex S.A.
- Aditya Birla Fashion & Retail Ltd.
- Hyosung TNC Corp.
- Far Eastern New Century Corp.
- PVH Corp.
- Nisshinbo Holdings Inc.
- Arvind Ltd.
- Chori Co. Ltd.
- DuPont de Nemours Inc.
- Freudenberg Group
- Berry Global Group Inc.
- Lenzing AG
- Reliance Industries Ltd. (RIL)
- Shandong Ruyi Technology Group
- Low & Bonar PLC
- Kimberly-Clark Corp.
Additional Benefits:
- The market estimate (ME) sheet in Excel format
- 3 months of analyst support
TABLE OF CONTENTS
1 INTRODUCTION
- 1.1 Study Assumptions & Market Definition
- 1.2 Scope of the Study
2 RESEARCH METHODOLOGY
3 EXECUTIVE SUMMARY
4 MARKET LANDSCAPE
- 4.1 Market Overview
- 4.2 Market Drivers
- 4.2.1 EU Digital Product Passport accelerating traceability technology investments
- 4.2.2 Uyghur Forced Labor Prevention Act (UFLPA) shifting sourcing toward certified non-Xinjiang cotton
- 4.2.3 Bio-based PEF polyester scaling from European pilot to commercial plants
- 4.2.4 Carbon-credit monetization programs boosting recycled-fibre profitability
- 4.2.5 AI-driven on-demand manufacturing reducing inventory waste and enabling micro-batch runs
- 4.2.6 Protective & antiviral textiles demand surge for pathogen-resilient indoor environments
- 4.3 Market Restraints
- 4.3.1 Escalating renewable-energy surcharges raising electricity costs for energy-intensive spinning mills
- 4.3.2 Tightening micro-plastic shedding regulations increasing R&D and compliance spend for synthetics
- 4.3.3 Red Sea shipping disruptions inflating freight costs for Asia-to-EU textile trade lanes
- 4.3.4 PFAS "forever-chemicals" bans forcing costly reformulation of performance finishes
- 4.4 Industry Value Chain Analysis
- 4.5 Regulatory Outlook
- 4.6 Technological Outlook
- 4.7 Porter's Five Forces Analysis
- 4.7.1 Bargaining Power of Buyers
- 4.7.2 Bargaining Power of Suppliers
- 4.7.3 Threat of New Entrants
- 4.7.4 Threat of Substitutes
- 4.7.5 Competitive Rivalry
- 4.8 Impact of Geopolitics on Textile Market
5 MARKET SIZE AND GROWTH FORECASTS (VALUE)
- 5.1 By Application
- 5.1.1 Fashion and Apparel
- 5.1.2 Industrial/Technical Textiles
- 5.1.3 Household and Home Textiles
- 5.1.4 Medical and Healthcare Textiles
- 5.1.5 Automotive and Transport Textiles
- 5.1.6 Other Applications (Protective, Sports Textiles, etc.)
- 5.2 By Raw Material
- 5.2.1 Natural Fibers
- 5.2.1.1 Cotton
- 5.2.1.2 Wool
- 5.2.1.3 Silk
- 5.2.2 Synthetic Fibers
- 5.2.2.1 Polyester
- 5.2.2.2 Nylon
- 5.2.2.3 Rayon / Viscose
- 5.2.2.4 Acrylic
- 5.2.2.5 Polypropylene
- 5.2.3 Recycled Fibers
- 5.2.4 Other Raw Materials (Speciality High-Performance Fibers (Aramid, Carbon, UHMWPE))
- 5.2.1 Natural Fibers
- 5.3 By Process / Technology
- 5.3.1 Woven
- 5.3.2 Knitted
- 5.3.3 Non-woven
- 5.3.3.1 Spunlaid (Spunbond / Melt-blown)
- 5.3.3.2 Dry-laid Hydro-entangled
- 5.3.3.3 Wet-Laid
- 5.3.3.4 Needle-punched
- 5.3.4 3-D Weaving and Spacer Fabrics
- 5.4 By Geography
- 5.4.1 North America
- 5.4.1.1 United States
- 5.4.1.2 Canada
- 5.4.1.3 Mexico
- 5.4.2 South America
- 5.4.2.1 Brazil
- 5.4.2.2 Argentina
- 5.4.2.3 Peru
- 5.4.2.4 Rest of South America
- 5.4.3 Europe
- 5.4.3.1 United Kingdom
- 5.4.3.2 Germany
- 5.4.3.3 France
- 5.4.3.4 Italy
- 5.4.3.5 Spain
- 5.4.3.6 BENELUX (Belgium, Netherlands, and Luxembourg)
- 5.4.3.7 NORDICS (Denmark, Finland, Iceland, Norway, and Sweden)
- 5.4.3.8 Rest of Europe
- 5.4.4 Asia-Pacific
- 5.4.4.1 China
- 5.4.4.2 India
- 5.4.4.3 Japan
- 5.4.4.4 Australia
- 5.4.4.5 South Korea
- 5.4.4.6 ASEAN (Indonesia, Thailand, Philippines, Malaysia, Vietnam)
- 5.4.4.7 Rest of Asia-Pacific
- 5.4.5 Middle East and Africa
- 5.4.5.1 Saudi Arabia
- 5.4.5.2 United Arab Emirates
- 5.4.5.3 Qatar
- 5.4.5.4 Kuwait
- 5.4.5.5 Turkey
- 5.4.5.6 Egypt
- 5.4.5.7 South Africa
- 5.4.5.8 Nigeria
- 5.4.5.9 Rest of Middle East and Africa
- 5.4.1 North America
6 COMPETITIVE LANDSCAPE
- 6.1 Market Concentration
- 6.2 Strategic Moves
- 6.3 Market Share Analysis
- 6.4 Company Profiles {(includes Global level Overview, Market level overview, Core Segments, Financials as available, Strategic Information, Products & Services, and Recent Developments)}
- 6.4.1 Toray Industries Inc.
- 6.4.2 Weiqiao Pioneering Group Co. Ltd.
- 6.4.3 Texhong Textile Group Ltd.
- 6.4.4 Inditex S.A.
- 6.4.5 Aditya Birla Fashion & Retail Ltd.
- 6.4.6 Hyosung TNC Corp.
- 6.4.7 Far Eastern New Century Corp.
- 6.4.8 PVH Corp.
- 6.4.9 Nisshinbo Holdings Inc.
- 6.4.10 Arvind Ltd.
- 6.4.11 Chori Co. Ltd.
- 6.4.12 DuPont de Nemours Inc.
- 6.4.13 Freudenberg Group
- 6.4.14 Berry Global Group Inc.
- 6.4.15 Lenzing AG
- 6.4.16 Reliance Industries Ltd. (RIL)
- 6.4.17 Shandong Ruyi Technology Group
- 6.4.18 Low & Bonar PLC
- 6.4.19 Kimberly-Clark Corp.
7 MARKET OPPORTUNITIES and FUTURE OUTLOOK
- 7.1 White-space & Unmet-Need Assessment

