
PUBLISHER: Mordor Intelligence | PRODUCT CODE: 2063406

PUBLISHER: Mordor Intelligence | PRODUCT CODE: 2063406
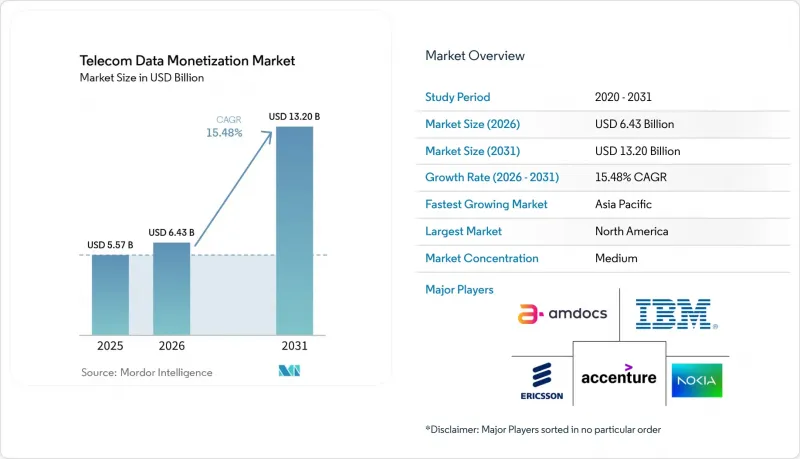
Telecom Data Monetization - Market Share Analysis, Industry Trends & Statistics, Growth Forecasts (2026 - 2031)
According to Mordor Intelligence, the telecom data monetization market size is projected to be USD 5.57 billion in 2025, USD 6.43 billion in 2026, and reach USD 13.20 billion by 2031, growing at a CAGR of 15.48% from 2026 to 2031.
This report is Segmented by Component (Platform and Services), Deployment Mode (Cloud and On-Premises), Application (Customer Experience Management, Network Management, and More), End User (Telecom Operators, Enterprises, and More), and Geography. The Market Forecasts are Provided in Terms of Value (USD).
Global Telecom Data Monetization Market Trends and Insights
Rapid Surge in Data Volume from 5G Networks
5G subscribers now generate 10-100X more traffic than 4G counterparts, offering an unprecedented substrate for real-time analytics. Verizon disclosed that its 5G users averaged 47 GB of monthly consumption in 2025, more than double that of 4G cohorts. AT&T's Aduna API platform capitalized on this traffic by producing USD 180 million of incremental revenue during its first year of operation. China Mobile processed 3.2 exabytes per month at edge nodes fitted to 5G base stations, unlocking low-latency industrial IoT contracts. Analyst estimates indicate that edge-enabled revenue streams could underpin 40% of enterprise 5G monetization by 2028.
Growing Adoption of Cloud-Native Monetization Platforms
Cloud-native stacks decouple monetization logic from legacy billing, cutting release cycles from quarters to weeks. Proximus migrated its entire BSS to Nokia's AVA cloud platform in 2025, trimming operational costs by 22% and slashing product-launch lead times to 14 days. LotusFlare's platform delivered similar agility for SoftBank and Taiwan Mobile, compressing launch timelines to under two weeks. Salesforce and Amdocs unified their CRM and AI monetization engines, enabling real-time journey orchestration that increased net promoter scores by 23% within 6 months.
Stringent Data Privacy and Sovereignty Regulations
GDPR fines have almost doubled since 2024, with Meta's EUR 1.2 billion (USD 1.4 billion) verdict spotlighting cross-border risk. TikTok's EUR 345 million (USD 404 million) penalty over children's data triggered sector-wide audits. Vodafone spent GBP 120 million (USD 162 million) on GDPR compliance in 2025. Privacy-enhancing computation mitigates exposure but inflates compute bills and stretches project timelines.
Other drivers and restraints analyzed in the detailed report include:
- Rising Demand for Personalized Customer Experiences
- Expansion of IoT and Edge Analytics Use-Cases
- Legacy IT and OSS/BSS Integration Complexity
For complete list of drivers and restraints, kindly check the Table Of Contents.
Segment Analysis
The Telecom data monetization market, attributed to platform solutions, reached 56.53% of the total market value. Services, although smaller, will accelerate at a 17.02% CAGR, as telcos concede that recruiting scarce data-science talent is more costly than revenue-sharing deals with specialist vendors. Accenture and IBM now guarantee minimum uplift clauses, absorbing financial risk while keeping operators' capital budgets in check. The shift underscores how the Telecom data monetization industry is evolving toward outcome-based engagements.
Managed analytics contracts are lengthening from 3 to 7 years, reflecting ongoing algorithm refresh requirements. Amdocs' FY 2025 report showed managed-services bookings rising 28% YoY, driven by multi-year monetization deals. Operators view this as a hedge against internal skills gaps; fewer than 8,000 professionals globally combine BSS fluency with advanced ML expertise. Vendors, in turn, bundle intellectual property rights to trained models, creating switching costs while also accelerating innovation cycles.
On-premises architectures captured 58.73% of 2025 spending because sovereignty mandates in banking, defense, and healthcare discourage off-site processing. Yet the cloud slice of the Telecom data monetization market is projected to grow at 17.66% CAGR, driven by containerized microservices that scale elastically during traffic peaks. Proximus trimmed launch cycles from 90 days to 14 days post-migration, proof that cloud reduces technical debt.
Regulation is gradually tilting the field. The EU Data Act compels providers to support seamless workload porting, curbing vendor lock-in. Hybrid models keep raw subscriber identifiers in national data centers while shipping anonymized aggregates to hyperscale clouds for heavy processing. Such dual-zone architectures allow telcos to meet compliance requirements while enjoying hyperscaler cost curves, accelerating adoption beyond IT-savvy tier-1s into mid-tier carriers.
Geography Analysis
North America contributed 38.91% of 2025 revenue and remains the epicenter of API-first monetization. AT&T's Aduna generated USD 180 million in year-one fees, while Verizon's 6G Innovation Forum produced latency-guaranteed proofs of concept for autonomous vehicles. Canada's Rogers grew data-services revenue 19% YoY, due to smart-city contracts. Regulatory stability under the FCC and CCPA provides clarity on compliance, accelerating time-to-market.
Asia-Pacific will register the highest CAGR of 19.03% through 2031. China Mobile processed 3.2 exabytes monthly at the edge, yielding CNY 28 billion (USD 3.9 billion) in industrial IoT revenue. Bharti Airtel's federated marketplace democratizes location intelligence for the Indian e-commerce and finance sectors, while Japan's SoftBank compressed product launches to two weeks via LotusFlare. Korea's SK Telecom and KT jointly invested USD 120 million in an edge consortium, targeting smart factories.
Europe grapples with soaring GDPR compliance costs of EUR 1.3 billion (USD 1.53 billion) in 2025 but counters with a five-operator federated Edge Continuum that preserves differential privacy while enabling pan-EU analytics. Middle East incumbents, fueled by 5G-Advanced rollouts, aim to achieve beyond-connectivity revenue equal to 25% of total service income by 2028. African carriers prioritize fintech monetization, leveraging ubiquitous mobile payment rails to offset lower ARPU.
- Accenture plc
- IBM Corporation
- Amdocs Limited
- Telefonaktiebolaget LM Ericsson
- Nokia Corporation
- Huawei Technologies Co., Ltd.
- Cisco Systems, Inc.
- Oracle Corporation
- SAP SE
- Teradata Corporation
- Subex Limited
- Mahindra Comviva Technologies Limited
- Allot Ltd.
- Optiva Inc.
- CSG Systems International, Inc.
- Comarch S.A.
- VIAVI Solutions Inc.
- NetScout Systems, Inc.
- Openet Telecom Limited
- Tecnotree Corporation
Additional Benefits:
- The market estimate (ME) sheet in Excel format
- 3 months of analyst support
TABLE OF CONTENTS
1 INTRODUCTION
- 1.1 Study Assumptions and Market Definition
- 1.2 Scope of the Study
2 RESEARCH METHODOLOGY
3 EXECUTIVE SUMMARY
4 MARKET LANDSCAPE
- 4.1 Market Overview
- 4.2 Market Drivers
- 4.2.1 Rapid Surge in Data Volume from 5G Networks
- 4.2.2 Growing Adoption of Cloud-Native Monetization Platforms
- 4.2.3 Rising Demand for Personalized Customer Experiences
- 4.2.4 Expansion of IoT and Edge Analytics Use-Cases
- 4.2.5 Emergence of Telco-Led Federated Data Marketplaces
- 4.2.6 Proliferation of Privacy-Enhancing Computation Enabling Cross-Carrier Insight Trading
- 4.3 Market Restraints
- 4.3.1 Stringent Data Privacy and Sovereignty Regulations
- 4.3.2 Legacy IT AND OSS/BSS Integration Complexity
- 4.3.3 Escalating Tariff-Driven Hardware Cost Volatility
- 4.3.4 Shortage of Telecom-Specific Data Science Talent
- 4.4 Industry Value Chain Analysis
- 4.5 Regulatory Landscape
- 4.6 Impact of Macroeconomic Factors
- 4.7 Technological Outlook
- 4.8 Porter's Five Forces Analysis
- 4.8.1 Threat of New Entrants
- 4.8.2 Bargaining Power of Suppliers
- 4.8.3 Bargaining Power of Buyers
- 4.8.4 Threat of Substitutes
- 4.8.5 Competitive Rivalry
5 MARKET SIZE AND GROWTH FORECASTS (VALUE)
- 5.1 By Component
- 5.1.1 Platform
- 5.1.2 Services
- 5.2 By Deployment Mode
- 5.2.1 Cloud
- 5.2.2 On-Premises
- 5.3 By Application
- 5.3.1 Customer Experience Management
- 5.3.2 Network Management
- 5.3.3 Marketing and Advertising
- 5.3.4 Risk and Compliance Management
- 5.4 By End User
- 5.4.1 Telecom Operators
- 5.4.2 Enterprises
- 5.4.3 Government
- 5.4.4 Other End Users
- 5.5 By Geography
- 5.5.1 North America
- 5.5.1.1 United States
- 5.5.1.2 Canada
- 5.5.1.3 Mexico
- 5.5.2 South America
- 5.5.2.1 Brazil
- 5.5.2.2 Argentina
- 5.5.2.3 Rest of South America
- 5.5.3 Europe
- 5.5.3.1 Germany
- 5.5.3.2 United Kingdom
- 5.5.3.3 France
- 5.5.3.4 Italy
- 5.5.3.5 Spain
- 5.5.3.6 Russia
- 5.5.3.7 Rest of Europe
- 5.5.4 Asia-Pacific
- 5.5.4.1 China
- 5.5.4.2 Japan
- 5.5.4.3 India
- 5.5.4.4 South Korea
- 5.5.4.5 Australia
- 5.5.4.6 Rest of Asia-Pacific
- 5.5.5 Middle East and Africa
- 5.5.5.1 Middle East
- 5.5.5.1.1 United Arab Emirates
- 5.5.5.1.2 Saudi Arabia
- 5.5.5.1.3 Turkey
- 5.5.5.1.4 Rest of Middle East
- 5.5.5.2 Africa
- 5.5.5.2.1 South Africa
- 5.5.5.2.2 Egypt
- 5.5.5.2.3 Nigeria
- 5.5.5.2.4 Rest of Africa
- 5.5.5.1 Middle East
- 5.5.1 North America
6 COMPETITIVE LANDSCAPE
- 6.1 Market Concentration
- 6.2 Strategic Moves
- 6.3 Market Share Analysis
- 6.4 Company Profiles (includes Global level Overview, Market level overview, Core Segments, Financials as available, Strategic Information, Market Rank/Share for key companies, Products and Services, and Recent Developments)
- 6.4.1 Accenture plc
- 6.4.2 IBM Corporation
- 6.4.3 Amdocs Limited
- 6.4.4 Telefonaktiebolaget LM Ericsson
- 6.4.5 Nokia Corporation
- 6.4.6 Huawei Technologies Co., Ltd.
- 6.4.7 Cisco Systems, Inc.
- 6.4.8 Oracle Corporation
- 6.4.9 SAP SE
- 6.4.10 Teradata Corporation
- 6.4.11 Subex Limited
- 6.4.12 Mahindra Comviva Technologies Limited
- 6.4.13 Allot Ltd.
- 6.4.14 Optiva Inc.
- 6.4.15 CSG Systems International, Inc.
- 6.4.16 Comarch S.A.
- 6.4.17 VIAVI Solutions Inc.
- 6.4.18 NetScout Systems, Inc.
- 6.4.19 Openet Telecom Limited
- 6.4.20 Tecnotree Corporation
7 MARKET OPPORTUNITIES AND FUTURE OUTLOOK
- 7.1 White-Space and Unmet-Need Assessment

