
PUBLISHER: Mordor Intelligence | PRODUCT CODE: 2063422

PUBLISHER: Mordor Intelligence | PRODUCT CODE: 2063422
Outcome-as-a-Service Software - Market Share Analysis, Industry Trends & Statistics, Growth Forecasts (2026 - 2031)
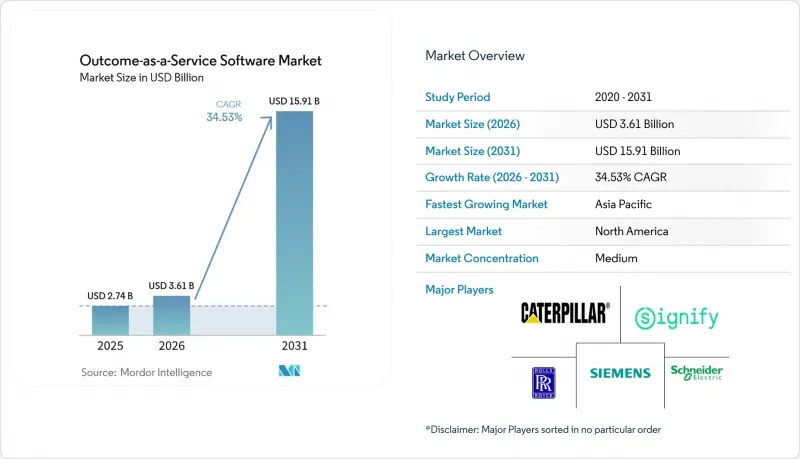
According to Mordor Intelligence, the outcome-as-a-Service software market size is projected to expand from USD 2.74 billion in 2025 and USD 3.61 billion in 2026 to USD 15.91 billion by 2031, registering a CAGR of 34.53% over 2026-2031.
This report is Segmented by Service Type (Advisory and Consulting, Implementation and Integration, and More), Pricing Model (Subscription-Based, Performance-Based, Gainshare, and Hybrid), Technology (AI and Analytics Platforms, Iot and Sensor Networks, and More), Application (Healthcare and Life Sciences, and More), and Geography. The Market Forecasts are Provided in Terms of Value (USD).
Global Outcome-as-a-Service Software Market Trends and Insights
Growing Demand for Pay-per-Outcome Commercial Models
Enterprises exhausted with billable-hour and parts-replacement contracts increasingly insist on fee structures pegged to uptime, throughput, or revenue uplift. Rolls-Royce's TotalCare program generated more than half of the firm's civil aerospace services revenue in 2025 by tying engine fees to flight hours, proving that predictable operating costs outweigh ownership for airlines. Similar mechanics underpin Michelin's pay-per-mile tire deals that delivered 5.9% fuel savings and 8% downtime reduction across 600,000 fleet vehicles in 2025. Warehouse-automation specialist Advanced Intralogistics bills clients on throughput velocity, aligning incentives with productivity gains. Outcome-aligned pricing boosts vendor lifetime value but requires robust telemetry and contractual clarity to avoid disputes.
Accelerated Enterprise Adoption of AI and Advanced Analytics Platforms
Predictive algorithms that flag failures 30-90 days in advance transform performance guarantees from speculative bets into data-driven commitments. C3 AI's Reliability application predicts equipment issues with 92% accuracy, allowing service providers to promise 98% availability without stockpiling spares. UptimeAI cut unplanned industrial downtime by 30% in 2025, enabling tighter service-level thresholds. IBM Maximo processed more than 1 billion sensor readings per day in 2025, serving as the analytical backbone for outcome contracts in utilities and heavy industry. As AI toolkits mature, vendors can price risk more precisely, encouraging broader adoption of performance-tied deals.
Difficulty in Defining and Attributing Measurable Outcomes
Outcome contracts often unravel when several suppliers influence the same metric, leading to disputes that stall payments. An academic study of 47 initiatives found that 38% failed to meet targets, with attribution issues driving 62% of renegotiations. GE Digital's Predix roll-out faltered once clients struggled to isolate platform gains from unrelated process tweaks. In healthcare, the Centers for Medicare and Medicaid Services canceled a value-based insurance pilot after multibillion-dollar costs could not be tied to patient outcomes. Until standardized measurement protocols emerge, vendors will prefer single-party environments where causality is clearer.
Other drivers and restraints analyzed in the detailed report include:
- Shift Toward Opex-Driven Consumption Preferences Across Industries
- ESG-Linked Outcome Contracts Incorporating Carbon-Reduction KPIs
- Heightened Contractual and Legal Exposure for Service Providers
For complete list of drivers and restraints, kindly check the Table Of Contents.
Segment Analysis
Managed outcome services accounted for 44.43% of 2025 revenue, underscoring client appetite for one-vendor accountability across complex asset fleets. The Outcome-as-a-Service software market size for managed offerings is expanding as incumbents leverage decades of operational data to guarantee uptime, efficiency, and compliance. Schneider Electric's EcoStruxure Foresight Operation, commercially released in Q3 2026, bundles 24/7 monitoring with predictive maintenance and promises a 75% reduction in failure risk, cementing the vendor's managed-service positioning.
Support and optimization services are forecast to grow at 34.89% annually to 2031 as installed bases mature, and buyers pursue incremental gains without disrupting current workflows. GE Digital's long-term agreements with renewable operator Invenergy exemplify post-deployment tuning that squeezes extra output from connected assets. Advisory work retains relevance for firms new to outcome economics, while implementation margins narrow as deployment processes standardize. The widening footprint of optimization deals signals sticky, high-margin recurring revenue for suppliers that command proprietary performance data, raising switching costs and deepening vendor entrenchment within the Outcome-as-a-Service software market.
Subscription structures captured 52.78% of revenue in 2025 because finance teams prefer budget certainty and minimal variance. These contracts anchor the Outcome-as-a-Service software market share for vendors that bundle hardware, software, and basic support into a flat monthly fee. That said, performance-based terms are rising at a 35.32% CAGR, propelled by demand for vendor-aligned incentives. Michelin's pay-per-mile framework, which prices tires by distance traveled, illustrates how usage metrics can replace upfront capital outlays.
Hybrid constructs now blend a base subscription with upside or downside adjustments, marrying cash-flow predictability to outcome accountability. Afni's gainshare deals, where the service provider takes 20-25% of verified cost savings, spotlight this compromise. As AI cuts variance in delivered results, vendors can bid aggressively on outcome components without jeopardizing profitability, reinforcing subscription retention while expanding risk-sharing economics across the Outcome-as-a-Service software market.
Geography Analysis
North America combines mature legal frameworks, rich analytics talent, and aggressive public-sector adoption to anchor 34.09% of 2025 revenue. The GSA's Outcome-Based Contracting Center of Excellence and the Centers for Medicare and Medicaid Services' expansion of accountable care programs institutionalize results-driven procurement, encouraging vendors to absorb performance risk in exchange for premium pricing. Canada is piloting performance-tied infrastructure concessions, and Mexico is embedding outcome metrics into power-sector reforms, broadening regional opportunity.
Asia-Pacific is the growth engine, with a 35.53% CAGR projected through 2031. China's Made in China 2025, India's Digital India initiative, and Japan's Society 5.0 policies mandate smart infrastructure that inherently requires outcome benchmarking. Regional enterprises exhibit high confidence in AI payback horizons, as shown by IBM research, and the Asian Development Bank confirms widespread broadband penetration that supports IoT telemetry. Nonetheless, adoption skews toward big enterprises and state-owned projects, while small businesses lag due to limited capital and expertise.
Europe benefits from sustainability statutes that reward verified emissions cuts, propelling light-as-a-service, virtual power plants, and other decarbonization-centric offerings. However, heterogeneous regulatory regimes slow cross-border scaling. In contrast, South America, the Middle East, and Africa remain nascent, with outcome contracts largely confined to donor-funded infrastructure or multinational rollouts. Absent stronger enforcement and standardized data, these regions will trail OECD peers for the foreseeable future.
- Rolls-Royce plc
- Signify N.V.
- Kaeser Kompressoren SE
- Schneider Electric SE
- Siemens AG
- Caterpillar Inc.
- Alstom SA
- GE Digital LLC
- Deere and Company
- Compagnie Generale des Etablissements Michelin SCA
- Bombardier Inc.
- Tacton Systems AB
- Viridien Group Limited
- Outcome Referrals Inc.
- ServiceMax Inc.
- Darktrace plc
- Omada Health Inc.
- Zipline International Inc.
- Indigo Ag Inc.
- DataRobot Inc.
Additional Benefits:
- The market estimate (ME) sheet in Excel format
- 3 months of analyst support
TABLE OF CONTENTS
1 INTRODUCTION
- 1.1 Study Assumptions and Market Definition
- 1.2 Scope of the Study
2 RESEARCH METHODOLOGY
3 EXECUTIVE SUMMARY
4 MARKET LANDSCAPE
- 4.1 Market Overview
- 4.2 Market Drivers
- 4.2.1 Growing Demand for Pay-per-Outcome Commercial Models
- 4.2.2 Accelerated Enterprise Adoption of AI and Advanced Analytics Platforms
- 4.2.3 Shift Toward Opex-Driven Consumption Preferences Across Industries
- 4.2.4 ESG-Linked Outcome Contracts Incorporating Carbon-Reduction KPIs
- 4.2.5 Public-Sector Mandates to Tie IT Spending to Performance Benchmarks
- 4.2.6 Emergence of Insurance-Backed Outcome Guarantees Reducing Buyer Risk
- 4.3 Market Restraints
- 4.3.1 Difficulty in Defining and Attributing Measurable Outcomes
- 4.3.2 Heightened Contractual and Legal Exposure for Service Providers
- 4.3.3 Falling AI Compute Costs Undermining Outcome-Pricing Unit Economics
- 4.3.4 Scarcity of Standardized Outcome Data in Emerging Economies
- 4.4 Impact of Macroeconomic Factors on the Market
- 4.5 Industry Value Chain Analysis
- 4.6 Regulatory Landscape
- 4.7 Technological Outlook
- 4.8 Porter's Five Forces Analysis
- 4.8.1 Bargaining Power of Suppliers
- 4.8.2 Bargaining Power of Buyers
- 4.8.3 Threat of New Entrants
- 4.8.4 Threat of Substitutes
- 4.8.5 Intensity of Competitive Rivalry
5 MARKET SIZE AND GROWTH FORECASTS (VALUE)
- 5.1 By Service Type
- 5.1.1 Advisory and Consulting
- 5.1.2 Implementation and Integration
- 5.1.3 Managed Outcome Services
- 5.1.4 Support and Optimization
- 5.2 By Pricing Model
- 5.2.1 Subscription-Based
- 5.2.2 Performance-Based
- 5.2.3 Gainshare
- 5.2.4 Hybrid
- 5.3 By Technology
- 5.3.1 AI and Analytics Platforms
- 5.3.2 IoT and Sensor Networks
- 5.3.3 Cloud and Edge Infrastructure
- 5.3.4 Digital Twin and Simulation
- 5.4 By Application
- 5.4.1 Healthcare and Life Sciences
- 5.4.2 Manufacturing and Industrial
- 5.4.3 BFSI
- 5.4.4 Retail and E-Commerce
- 5.4.5 Energy and Utilities
- 5.5 By Geography
- 5.5.1 North America
- 5.5.1.1 United States
- 5.5.1.2 Canada
- 5.5.1.3 Mexico
- 5.5.2 South America
- 5.5.2.1 Brazil
- 5.5.2.2 Argentina
- 5.5.2.3 Rest of South America
- 5.5.3 Europe
- 5.5.3.1 United Kingdom
- 5.5.3.2 Germany
- 5.5.3.3 France
- 5.5.3.4 Italy
- 5.5.3.5 Spain
- 5.5.3.6 Rest of Europe
- 5.5.4 Asia-Pacific
- 5.5.4.1 China
- 5.5.4.2 Japan
- 5.5.4.3 India
- 5.5.4.4 South Korea
- 5.5.4.5 Rest of Asia-Pacific
- 5.5.5 Middle East and Africa
- 5.5.5.1 Middle East
- 5.5.5.1.1 United Arab Emirates
- 5.5.5.1.2 Saudi Arabia
- 5.5.5.1.3 Rest of Middle East
- 5.5.5.2 Africa
- 5.5.5.2.1 South Africa
- 5.5.5.2.2 Egypt
- 5.5.5.2.3 Rest of Africa
- 5.5.5.1 Middle East
- 5.5.1 North America
6 COMPETITIVE LANDSCAPE
- 6.1 Market Concentration
- 6.2 Strategic Moves
- 6.3 Market Share Analysis
- 6.4 Company Profiles (includes Global Level Overview, Market Level Overview, Core Segments, Financials as available, Strategic Information, Market Rank/Share, Products and Services, Recent Developments)
- 6.4.1 Rolls-Royce plc
- 6.4.2 Signify N.V.
- 6.4.3 Kaeser Kompressoren SE
- 6.4.4 Schneider Electric SE
- 6.4.5 Siemens AG
- 6.4.6 Caterpillar Inc.
- 6.4.7 Alstom SA
- 6.4.8 GE Digital LLC
- 6.4.9 Deere and Company
- 6.4.10 Compagnie Generale des Etablissements Michelin SCA
- 6.4.11 Bombardier Inc.
- 6.4.12 Tacton Systems AB
- 6.4.13 Viridien Group Limited
- 6.4.14 Outcome Referrals Inc.
- 6.4.15 ServiceMax Inc.
- 6.4.16 Darktrace plc
- 6.4.17 Omada Health Inc.
- 6.4.18 Zipline International Inc.
- 6.4.19 Indigo Ag Inc.
- 6.4.20 DataRobot Inc.
7 MARKET OPPORTUNITIES AND FUTURE OUTLOOK
- 7.1 White-Space and Unmet-Need Assessment

