
PUBLISHER: Mordor Intelligence | PRODUCT CODE: 2063690

PUBLISHER: Mordor Intelligence | PRODUCT CODE: 2063690
Life Science And Chemical Instrumentation - Market Share Analysis, Industry Trends & Statistics, Growth Forecasts (2026 - 2031)
According to Mordor Intelligence, the life science and chemical instrumentation market size is projected to be USD 65.61 billion in 2025, USD 70.02 billion in 2026, and reach USD 97.05 billion by 2031, growing at a CAGR of 6.75% from 2026 to 2031.
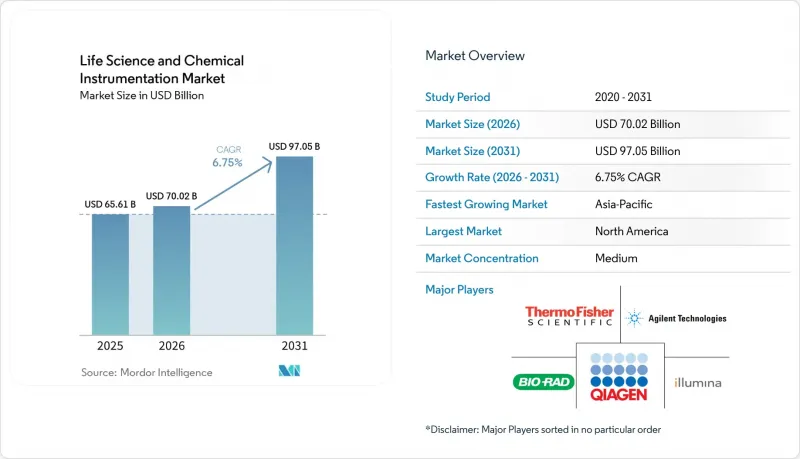
This report is Segmented by Product (Instruments, Consumables, Software), Technology (Spectroscopy, Chromatography, PCR, NGS, and More), End-User (Pharmaceutical & Biotechnology Companies, Hospitals & Diagnostic Centers, and More), and Geography (North America, Europe, Asia-Pacific, Middle East & Africa, South America). Market Forecasts are Provided in Terms of Value (USD).
Global Life Science And Chemical Instrumentation Market Trends and Insights
Surging Pharmaceutical & Biotech R&D Budgets
Global R&D spending rebounded unevenly in 2025; companies with obesity and GLP-1 franchises raised budgets by double digits, channeling extra capital toward ultra-high-performance liquid chromatography and high-parameter flow cytometry that characterize antibody-drug conjugates and CAR-T products. Oncology now captures 31.5% of outsourced discovery, compelling CROs to expand digital PCR and next-generation sequencing capacity that quantifies low-frequency tumor mutations in plasma. Nine of the top 10 biopharma deals in 2023 included precision-medicine assets, signaling a durable preference for analytical platforms that resolve single-cell heterogeneity and multi-omic signatures. These dynamics ensure sustained purchase cycles for chromatography, mass spectrometry, and sequencing systems across both sponsor and service-provider ecosystems. Vendors that embed Bayesian algorithms to automate method development further improve utilization, making them preferred choices for labs battling labor shortages.
Stringent Global Regulatory & Quality-Control Requirements
The FDA's 2024 New Approach Methodologies guidance explicitly endorses organ-on-chip and high-content imaging, driving immediate procurement of microfluidic and automated microscopy instruments and rendering many legacy bench spectrometers obsolete. Europe's Adverse Event Management System mandates real-time data uploads, compelling CROs to retrofit chromatography and mass spectrometry units with cloud connectors that add electronic signatures and audit trails. Compliance retrofits cost USD 50,000-150,000 per unit, a burden smaller labs struggle to shoulder, which steers demand toward integrated platforms that ship with 21 CFR Part 11 and GDPR modules out-of-the-box. ISO 17025 accreditation timelines have doubled to one year as auditors scrutinize cybersecurity, intensifying upgrade cycles that favor vendors with secure firmware and remote-monitoring capabilities. Collectively, these rules move purchasing criteria beyond analytical performance toward traceability, data integrity, and cybersecurity maturity.
High Capital & Operating Costs of Advanced Laboratory Analytical Instruments
Illumina's NovaSeq X Plus lists above USD 1 million with annual consumable obligations of USD 200,000-300,000, exceeding entire instrumentation budgets for many academic cores. Digital PCR cartridges cost USD 8-12 per sample, about triple the real-time PCR costs, limiting uptake to reimbursable oncology diagnostics. Spectroscopy leases run 1.8-3.3% of list price monthly; a USD 200,000 FTIR, therefore, costs USD 3,600-6,600 per month, a strain when utilization dips under 60%. Mass-spec service contracts average 12-15% of purchase price per year, and vendors increasingly require bundled software subscriptions that push total annual spend above USD 50,000 per LC-MS unit. These economic slow refresh cycles are especially prevalent in emerging markets that lack grant or venture funding.
Other drivers and restraints analyzed in the detailed report include:
- Rapid Adoption of Automation & Miniaturization in Laboratory Analytical Instruments
- Expansion of Precision-Medicine & Multi-Omics Workflows
- Shortage of Skilled Analytical Scientists & Service Engineers
For complete list of drivers and restraints, kindly check the Table Of Contents.
Segment Analysis
Instruments still generated 63.66% of 2025 revenue, but consumables posted the highest trajectory at a 7.23% CAGR, reflecting the razor-blade economics underpinning modern vendor strategies. Chromatography columns require replacement every 500-2,000 injections, while Bio-Rad's droplet-generation cartridges secure an annuity stream priced three to five times conventional PCR reagents.
Software, the smallest category by dollars, is expected to rise fastest in percentage terms as vendors charge USD 5,000-15,000 annually per instrument for cloud data storage, predictive maintenance, and compliance reporting. Gross margins surpass 80%, encouraging firms to bundle software into instrument subscription contracts that promise 99% uptime, creating sticky, high-margin relationships.
Geography Analysis
North America retained 42.20% share in 2025, driven by tightly regulated pharmaceutical manufacturing, NIH-funded research infrastructure, and a concentrated vendor base that supports rapid service response. Although the region's growth decelerates relative to emerging markets, a vast installed base ensures steady replacement as FDA guidance pushes labs toward organ-on-chip and high-content imaging solutions. Canada's biomanufacturing incentives and Mexico's nearshoring gains add incremental demand for chromatography and spectroscopy platforms.
Asia-Pacific is projected to record an 8.45% CAGR through 2031. India's Production Linked Incentive scheme unlocked USD 26 billion in investment across 191 bulk-drug intermediates, each requiring chromatography and mass spectrometry for quality control. Karnataka's Industrial Policy offers 25% capital subsidies, slicing the life science and chemical instrumentation market's total cost of ownership by up to 20% and enticing Agilent, Waters, and Thermo Fisher to open application labs in Bengaluru and Hyderabad. China's subsidies for domestic instrument builders spur double-digit local growth despite geopolitical risks tied to rare-earth export controls. Japan, South Korea, and Australia contribute stable but smaller volumes linked to pharmaceutical production and academic research.
Europe sits third by value. Germany's process-analytical-technology requirements, the UK's shared core-facility model, and France's oncology research underpin demand. EMA data-integrity mandates push adoption of cloud-connected chromatography and mass spectrometry with embedded audit trails. South America and Middle East & Africa remain nascent, yet GCC hospital expansions and Brazil's biotech clusters lift regional orders, especially where leasing and instrument-as-a-service models bridge capital constraints.
- Agilent Technologies
- Beckton Dickinson
- Bio-Rad Laboratories
- Bruker
- Danaher
- Eppendorf
- GE HealthCare (Cytiva)
- Hitachi High-Tech Corp.
- HORIBA
- Illumina
- JEOL Ltd.
- Merck
- Mettler Toledo
- Oxford Instruments
- PerkinElmer Inc. (Revvity)
- QIAGEN
- Sartorius
- Shimadzu
- Thermo Fisher Scientific
- Waters Corporation
Additional Benefits:
- The market estimate (ME) sheet in Excel format
- 3 months of analyst support
TABLE OF CONTENTS
1 Introduction
- 1.1 Study Assumptions & Market Definition
- 1.2 Scope of the Study
2 Research Methodology
3 Executive Summary
4 Market Landscape
- 4.1 Market Overview
- 4.2 Market Drivers
- 4.2.1 Surging Pharmaceutical & Biotech R&D Budgets
- 4.2.2 Stringent Global Regulatory & Quality-Control Requirements
- 4.2.3 Rapid Adoption of Automation & Miniaturization in Laboratories
- 4.2.4 Expansion of Precision-Medicine & Multi-Omics Workflows
- 4.2.5 Government Incentives for Domestic Instrument Manufacturing
- 4.2.6 Subscription-Based "Instrument-As-A-Service" Models Gaining Traction
- 4.3 Market Restraints
- 4.3.1 High Capital & Operating Costs of Advanced Instruments
- 4.3.2 Shortage of Skilled Analytical Scientists & Service Engineers
- 4.3.3 Supply-Chain Vulnerability for Semiconductor/Rare-Earth Components
- 4.3.4 Cyber-Security & Data-Integrity Compliance Burden for Cloud-Connected Devices
- 4.4 Regulatory Landscape
- 4.5 Technological Outlook
- 4.6 Porter's Five Forces Analysis
- 4.6.1 Threat of New Entrants
- 4.6.2 Bargaining Power of Buyers
- 4.6.3 Bargaining Power of Suppliers
- 4.6.4 Threat of Substitutes
- 4.6.5 Competitive Rivalry
5 Market Size & Growth Forecasts
- 5.1 By Product
- 5.1.1 Instruments
- 5.1.2 Consumables
- 5.1.3 Software
- 5.2 By Technology
- 5.2.1 Spectroscopy
- 5.2.2 Chromatography
- 5.2.3 Polymerase Chain Reaction (PCR)
- 5.2.4 Next-Generation Sequencing (NGS)
- 5.2.5 Flow Cytometry
- 5.2.6 Microscopy
- 5.2.7 Electrophoresis
- 5.2.8 Centrifuges
- 5.3 By End-User
- 5.3.1 Pharmaceutical & Biotechnology Companies
- 5.3.2 Hospitals & Diagnostic Centers
- 5.3.3 Contract Research Organizations (CROs)
- 5.3.4 Academia & Research Institutes
- 5.4 By Geography
- 5.4.1 North America
- 5.4.1.1 United States
- 5.4.1.2 Canada
- 5.4.1.3 Mexico
- 5.4.2 Europe
- 5.4.2.1 Germany
- 5.4.2.2 United Kingdom
- 5.4.2.3 France
- 5.4.2.4 Italy
- 5.4.2.5 Spain
- 5.4.2.6 Rest of Europe
- 5.4.3 Asia-Pacific
- 5.4.3.1 China
- 5.4.3.2 Japan
- 5.4.3.3 India
- 5.4.3.4 Australia
- 5.4.3.5 South Korea
- 5.4.3.6 Rest of Asia-Pacific
- 5.4.4 Middle East & Africa
- 5.4.4.1 GCC
- 5.4.4.2 South Africa
- 5.4.4.3 Rest of Middle East & Africa
- 5.4.5 South America
- 5.4.5.1 Brazil
- 5.4.5.2 Argentina
- 5.4.5.3 Rest of South America
- 5.4.1 North America
6 Competitive Landscape
- 6.1 Market Concentration
- 6.2 Market Share Analysis
- 6.3 Company Profiles (includes Global Level Overview, Market-Level Overview, Core Segments, Financials, Strategic Information, Market Rank/Share, Products & Services, Recent Developments)
- 6.3.1 Agilent Technologies Inc.
- 6.3.2 Becton, Dickinson and Company
- 6.3.3 Bio-Rad Laboratories Inc.
- 6.3.4 Bruker Corporation
- 6.3.5 Danaher Corporation
- 6.3.6 Eppendorf AG
- 6.3.7 GE HealthCare (Cytiva)
- 6.3.8 Hitachi High-Tech Corp.
- 6.3.9 Horiba Ltd.
- 6.3.10 Illumina Inc.
- 6.3.11 JEOL Ltd.
- 6.3.12 Merck KGaA
- 6.3.13 Mettler-Toledo International Inc.
- 6.3.14 Oxford Instruments plc
- 6.3.15 PerkinElmer Inc. (Revvity)
- 6.3.16 QIAGEN N.V.
- 6.3.17 Sartorius AG
- 6.3.18 Shimadzu Corporation
- 6.3.19 Thermo Fisher Scientific Inc.
- 6.3.20 Waters Corporation
7 Market Opportunities & Future Outlook
- 7.1 White-space & Unmet-need Assessment

