
PUBLISHER: Mordor Intelligence | PRODUCT CODE: 2063821

PUBLISHER: Mordor Intelligence | PRODUCT CODE: 2063821
VRAM - Market Share Analysis, Industry Trends & Statistics, Growth Forecasts (2026 - 2031)
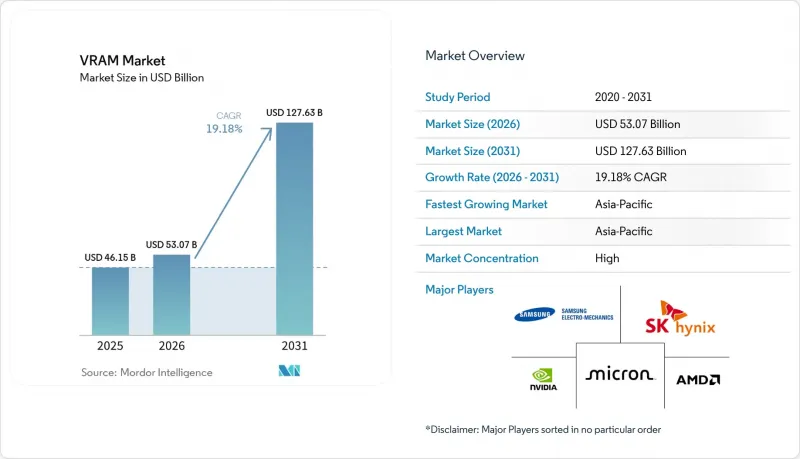
According to Mordor Intelligence, the vRAM market size was valued at USD 46.15 billion in 2025 and is estimated to grow from USD 53.07 billion in 2026 to reach USD 127.63 billion by 2031, at a CAGR of 19.18% during the forecast period (2026-2031).
This report is Segmented by Memory Architecture (GDDR-Based VRAM, and HBM-Based VRAM), VRAM Capacity (≤8 GB, 8-16 GB, 16-32 GB, 32-64 GB, and Above 64 GB), Application (Gaming, Data Center and AI, Professional Visualization, and Edge AI and Embedded), and Geography (North America, Europe, Asia-Pacific, South America, and Middle East and Africa). The Market Forecasts are Provided in Terms of Value (USD).
Global VRAM Market Trends and Insights
Explosive AI Training Workloads in Hyperscale Data Centers
Rising complexity in large language models is forcing every flagship accelerator to integrate ever-larger HBM stacks. A single high-end GPU now carries memory that costs more than its logic die, and multi-year capacity reservations by cloud providers have removed spot-market flexibility. The resulting demand shock gives memory makers durable pricing power and decouples the VRAM market from historic DRAM boom-bust swings. Capital spending on AI-class data centers, therefore, reinforces long-run revenue visibility for HBM producers.
Mainstream Adoption of 4K/8K Gaming and Ray-Tracing GPUs
Consumer GPUs must now buffer ultra-high-resolution textures and ray-tracing acceleration data structures, lifting baseline card capacities to 16 GB and above. Mid-cycle console refreshes sustain a floor under GDDR shipments, while workstation variants stretch the same technology to 96 GB for real-time engineering workloads. Tight HBM supply is pushing suppliers to prioritize higher-margin stacks, indirectly tightening GDDR availability and supporting firm pricing through late 2027.
Persistent HBM Supply Bottlenecks and Long Fab Lead-Times
Advanced packaging capacity for stacked memory remains the most significant bottleneck in the market. Building new facilities to address this issue takes nearly 2 years, followed by an additional 6 months or more for customer qualification processes. This prolonged timeline has resulted in persistent shortages, even as the industry records record levels of capital investment to expand capacity. Furthermore, sub-70% yields observed in the latest HBM3E layers exacerbate production risks. To make matters worse, reallocating wafer starts from GDDR to HBM to meet high-performance demands has further constrained the availability of mid-range GPUs, creating additional challenges for the market.
Other drivers and restraints analyzed in the detailed report include:
- Transition to GDDR7 and HBM3E Memory Standards
- Edge AI Growth in Automotive ADAS and Industrial Robots
- High Cost Differential Between HBM and Conventional GDDR
For complete list of drivers and restraints, kindly check the Table Of Contents.
Segment Analysis
HBM-based devices accounted for a smaller share of shipments in 2025, yet are forecast to post a leading 19.38% CAGR between 2026 and 2031. This growth trajectory reflects hyperscale AI platforms' prioritization of terabyte-scale bandwidth, which is critical for handling complex workloads and large-scale data processing. These platforms are willing to absorb the higher cost per gigabyte due to the significant performance benefits HBM offers. Samsung began commercial HBM4 shipments in 2026, delivering 3.3 TB/s per stack, significantly widening the performance gap over GDDR alternatives and further solidifying HBM's position in high-performance computing applications.
GDDR technology, while still holding 62.73% market share, remains indispensable for applications such as desktop gaming, professional visualization, and the rapidly growing demand for 8K content creation. The introduction of GDDR7, with its up to 32 Gbps transfer rates, extends the technology's relevance and ensures its continued adoption in cost-sensitive and performance-driven markets. This diversification within the video random access memory market prevents HBM from monopolizing the segment, maintaining a balance between high-performance and cost-effective solutions.
Geography Analysis
Asia-Pacific holds a dominant position as the manufacturing backbone of the VRAM supply chain, accounting for 67.17% of the revenue share in 2025. The region benefits from the significant investments made by Korean and Taiwanese foundries, which are allocating over USD 100 billion in 2026 to expand HBM clean-room facilities and advanced packaging capabilities. These efforts are expected to help the region maintain a robust forecasted CAGR of 20.14%. Additionally, the rapid development of AI infrastructure in countries like India and Southeast Asia is driving local consumption, further supporting export-led growth and solidifying the region's leadership in the global VRAM market.
North America, despite having minimal domestic DRAM wafer production, emerges as the largest consumer block when hyperscale imports are included. The CHIPS Act, which provides over USD 15 billion in grants and loans, aims to localize wafer and packaging capacity within the region. However, significant production volumes are not anticipated before 2028. SK hynix secured USD 458 million in grants and up to USD 500 million in loans to establish an advanced packaging facility in Indiana, targeting HBM assembly and test capacity to serve U.S. hyperscalers with reduced lead times. In the meantime, North American cloud providers remain heavily dependent on trans-Pacific supply chains, which are susceptible to disruptions caused by geopolitical tensions. This reliance underscores the importance of diversifying supply sources to mitigate potential risks.
Europe, while lagging in fabrication capabilities, is witnessing a growing demand for VRAM in applications such as automotive advanced driver-assistance systems (ADAS) and industrial robotics. Initiatives like the European Chips Act have allocated funding to establish local pilot production lines, but the absence of full-scale HBM production continues to limit the region's contribution to the global supply chain. Meanwhile, South America and the Middle East and Africa contribute smaller volumes, primarily driven by demand in gaming and entry-level professional workloads. Although these regions exhibit relatively modest growth, they maintain steady progress within the global VRAM market, ensuring their relevance in the broader industry landscape.
- Samsung Electronics Co. Ltd.
- SK Hynix Inc.
- Micron Technology Inc.
- NVIDIA Corporation
- Advanced Micro Devices Inc.
- Intel Corporation
- Qualcomm Technologies Inc.
- Taiwan Semiconductor Manufacturing Company Limited
- GLOBALFOUNDRIES Inc.
- ASE Technology Holding Co. Ltd.
- Rambus Inc.
- Cadence Design Systems Inc.
- Synopsys Inc.
- Winbond Electronics Corporation
- ChangXin Memory Technologies Inc.
- Nanya Technology Corporation
- Powerchip Semiconductor Manufacturing Corp.
- GigaDevice Semiconductor Inc.
- Arm Limited
- Kioxia Corporation
- Broadcom Inc.
- Marvell Technology Inc.
- IBM Corporation
Additional Benefits:
- The market estimate (ME) sheet in Excel format
- 3 months of analyst support
TABLE OF CONTENTS
1 INTRODUCTION
- 1.1 Study Assumptions and Market Definition
- 1.2 Scope of the Study
2 RESEARCH METHODOLOGY
3 EXECUTIVE SUMMARY
4 MARKET LANDSCAPE
- 4.1 Market Overview
- 4.2 Market Drivers
- 4.2.1 Explosive AI Training Workloads in Hyperscale Data Centers
- 4.2.2 Mainstream Adoption of 4K/8K Gaming and Ray-Tracing GPUs
- 4.2.3 Transition to GDDR7 and HBM3E Memory Standards
- 4.2.4 Edge AI Growth in Automotive ADAS and Industrial Robots
- 4.2.5 Government CHIPS Incentives Accelerating Domestic Memory Fabs
- 4.2.6 On-Package Compute-in-Memory Architectures Reducing Latency
- 4.3 Market Restraints
- 4.3.1 Persistent HBM Supply Bottlenecks and Long Fab Lead-Times
- 4.3.2 High Cost Differential Between HBM and Conventional GDDR
- 4.3.3 Geopolitical Export Controls on Advanced Memory Technologies
- 4.3.4 Integrated Graphics Performance Cannibalizing Entry-Level GPUs
- 4.4 Impact of Macroeconomic Factors on the Market
- 4.5 Industry Value Chain Analysis
- 4.6 Regulatory Landscape
- 4.7 Technological Outlook
- 4.8 Porter's Five Forces Analysis
- 4.8.1 Bargaining Power of Suppliers
- 4.8.2 Bargaining Power of Buyers
- 4.8.3 Threat of New Entrants
- 4.8.4 Threat of Substitutes
- 4.8.5 Intensity of Competitive Rivalry
5 MARKET SIZE AND GROWTH FORECASTS (VALUE)
- 5.1 By Memory Architecture
- 5.1.1 GDDR-based VRAM
- 5.1.2 HBM-based VRAM
- 5.2 By VRAM Capacity
- 5.2.1 <= 8 GB
- 5.2.2 8-16 GB
- 5.2.3 16-32 GB
- 5.2.4 32-64 GB
- 5.2.5 Above 64 GB
- 5.3 By Application
- 5.3.1 Gaming
- 5.3.2 Data Center and AI
- 5.3.3 Professional Visualization
- 5.3.4 Edge AI and Embedded
- 5.4 By Geography
- 5.4.1 North America
- 5.4.1.1 United States
- 5.4.1.2 Canada
- 5.4.1.3 Mexico
- 5.4.2 Europe
- 5.4.2.1 United Kingdom
- 5.4.2.2 Germany
- 5.4.2.3 France
- 5.4.2.4 Italy
- 5.4.2.5 Rest of Europe
- 5.4.3 Asia-Pacific
- 5.4.3.1 China
- 5.4.3.2 Japan
- 5.4.3.3 India
- 5.4.3.4 South Korea
- 5.4.3.5 Southeast Asia
- 5.4.3.6 Rest of Asia-Pacific
- 5.4.4 South America
- 5.4.4.1 Brazil
- 5.4.4.2 Rest of South America
- 5.4.5 Middle East and Africa
- 5.4.1 North America
6 COMPETITIVE LANDSCAPE
- 6.1 Market Concentration
- 6.2 Strategic Moves
- 6.3 Market Share Analysis
- 6.4 Company Profiles (includes Global Level Overview, Market Level Overview, Core Segments, Financials as available, Strategic Information, Market Rank/Share, Products and Services, Recent Developments)
- 6.4.1 Samsung Electronics Co. Ltd.
- 6.4.2 SK Hynix Inc.
- 6.4.3 Micron Technology Inc.
- 6.4.4 NVIDIA Corporation
- 6.4.5 Advanced Micro Devices Inc.
- 6.4.6 Intel Corporation
- 6.4.7 Qualcomm Technologies Inc.
- 6.4.8 Taiwan Semiconductor Manufacturing Company Limited
- 6.4.9 GLOBALFOUNDRIES Inc.
- 6.4.10 ASE Technology Holding Co. Ltd.
- 6.4.11 Rambus Inc.
- 6.4.12 Cadence Design Systems Inc.
- 6.4.13 Synopsys Inc.
- 6.4.14 Winbond Electronics Corporation
- 6.4.15 ChangXin Memory Technologies Inc.
- 6.4.16 Nanya Technology Corporation
- 6.4.17 Powerchip Semiconductor Manufacturing Corp.
- 6.4.18 GigaDevice Semiconductor Inc.
- 6.4.19 Arm Limited
- 6.4.20 Kioxia Corporation
- 6.4.21 Broadcom Inc.
- 6.4.22 Marvell Technology Inc.
- 6.4.23 IBM Corporation
7 MARKET OPPORTUNITIES AND FUTURE OUTLOOK
- 7.1 White-Space and Unmet-Need Assessment

