
PUBLISHER: Mordor Intelligence | PRODUCT CODE: 2063835

PUBLISHER: Mordor Intelligence | PRODUCT CODE: 2063835
AI In Pharmacovigilance - Market Share Analysis, Industry Trends & Statistics, Growth Forecasts (2026 - 2031)
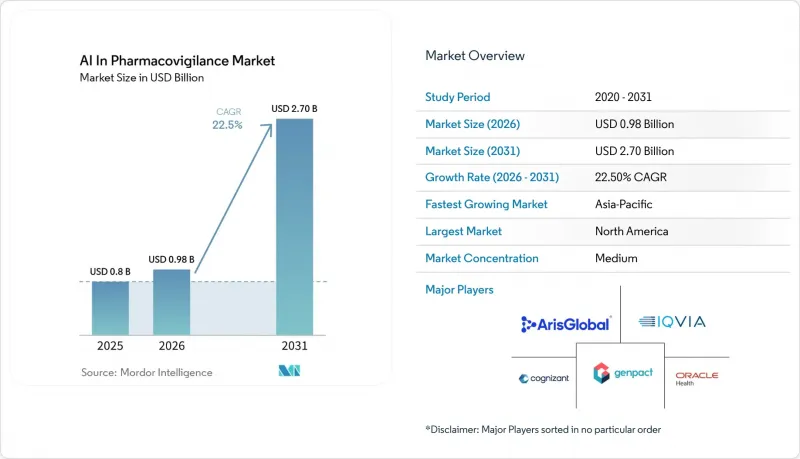
According to Mordor Intelligence, the aI in pharmacovigilance market size is expected to increase from USD 0.8 billion in 2025 to USD 0.98 billion in 2026 and reach USD 2.70 billion by 2031, growing at a CAGR of 22.5% over 2026-2031.
This report is Segmented by Component (Software Platforms, Services), Deployment Model (Cloud-Based, On-Premise), Application (Adverse Event Case Processing, Signal Detection & Prioritisation), End-User (Pharmaceutical & Biotech, Cros, Regulators), and Geography (North America, Europe, Asia-Pacific, MEA, South America). Market Forecasts are in Value (USD).
Global AI In Pharmacovigilance Market Trends and Insights
Rising Volume and Complexity of Safety Data
Annual ICSR submissions to FAERS topped 1.9 million in 2024, and EudraVigilance received 1.7 million ADRs in the same year, straining manual triage workflows. Social-media posts, EHR extracts, and wearable-device feeds enlarge data lakes that classical keyword filters cannot parse. AI pipelines now achieve 85-100% entity-match rates for structured clinical reports and reduce human correction to just 3.5% of data points. With every extra data stream, the AI in pharmacovigilance market becomes more indispensable to sponsors that must keep pace with twenty-four-hour regulatory reporting clocks.
Regulatory Push for Real-Time Monitoring
The FDA's EDSTP, initiated in 2024, schedules quarterly sponsor meetings to evaluate AI systems, moving policy from retrospective submissions toward concurrent oversight. Across the Atlantic, revised EU rules obligate marketing authorization holders to monitor digital channels for unsolicited ADRs and submit serious unexpected cases within 15 days. Daily social-media output approaches 500 million posts, and roughly 0.02% reference medicines or side effects, a scale only AI can screen promptly, driving recurring investment in the AI in Pharmacovigilance market.
Data Privacy and Cross-Border Transfer Rules
Multinational pharmaceutical companies are facing challenges due to regulations such as GDPR, China's PIPL, and Japan's APPI, which limit the offshore storage of health data. Consequently, these companies must either isolate datasets or implement regional cloud solutions. Additionally, there is a significant risk of LLMs re-identifying patients, as public-data pre-training can unintentionally embed personal information. A 2025 study revealed an 83% hallucination rate in clinical vignettes. Compliance costs are further slowing some deployments, restricting short-term growth in the AI in Pharmacovigilance market.
Other drivers and restraints analyzed in the detailed report include:
- Cost Pressure to Automate Case Processing
- Social-Listening NLP for Patient-Reported Outcomes
- Algorithmic Opacity and Regulatory Defensibility
For complete list of drivers and restraints, kindly check the Table Of Contents.
Segment Analysis
In 2025, platforms accounted for 64.15% of the revenue, driven by Oracle Argus Safety, ArisGlobal LifeSphere, and Veeva Vault Safety suites. These platforms integrate intake, MedDRA coding, and E2B(R3) submissions into a single validated environment, minimizing audit risks. This unified change control feature is particularly appealing to top-20 pharmaceutical firms, each handling over 500,000 cases annually. Meanwhile, services, which make up the remaining portion of the AI in Pharmacovigilance market, are witnessing robust growth at a 23.45% CAGR. This surge is largely due to mid-tier biotech firms, lacking in-house validation teams, opting for turnkey outsourcing solutions. The EU AI Act mandates continuous AI model monitoring, periodic retraining, and explainability assessments, transforming consulting hours into a consistent revenue stream.
In 2025, cloud models dominated the AI in Pharmacovigilance market with a 71.15% share and are projected to grow at a 23.85% CAGR, outpacing on-premise solutions. SaaS platforms offer versionless compliance, allowing vendors to implement overnight changes in ICH, MedDRA, and FDA forms. This capability eliminates downtime cycles associated with IQ/OQ/PQ. With pay-per-user pricing starting around USD 600 annually per user, organizations can shift from capital expenditures (CapEx) to operational expenditures (OpEx), avoiding server decommissioning costs. This results in IT maintenance bills that are 40% lower than those of on-premise setups.
Geography Analysis
North America generated 41.56% of 2025 revenue, driven by the United States' USD 600 billion pharmaceutical economy and the extensive 800 million-patient database of the Sentinel Initiative. The region demonstrates the highest cloud adoption, with 85% of drug-safety executives planning to increase AI budgets in 2026, reinforcing North America's leadership in the AI in Pharmacovigilance market.
Asia-Pacific, however, is projected to grow at a 23.35% CAGR, supported by China, India, Japan, and South Korea, which collectively host more than one-third of global clinical trials, creating proportional safety workloads. Regulatory harmonization, including PMDA's ICH E2B(R3) activation in 2025 and NMPA's alignment roadmap, enables cross-border data flow within standardized message structures, encouraging SaaS adoption. The expansion of cloud availability zones across India and Southeast Asia allows CROs to store patient data locally while utilizing hyperscale GPU clusters, enhancing regional AI deployments and contributing to the growth of the AI in the Pharmacovigilance market size.
South America and the Middle East & Africa remain smaller but show targeted progress. Brazil's regulator has introduced a sandbox for AI-enabled vigilance, and the African Medicines Agency, recognized as a WHO-Listed Authority since 2024, is coordinating regional post-market surveillance, necessitating tools beyond manual spreadsheets. These developments sustain vendor pipelines and highlight the long-term potential of the AI in Pharmacovigilance market as broadband and cloud infrastructure continue to advance.
- AB Cube
- Accenture
- Anju Software
- Aris Global
- Capgemini
- Clario (formerly BioClinica)
- Cloudbyz
- Cognizant
- Ennov
- Genpact
- IBM Merative
- IQVIA
- Oracle
- Parexel International
- Sparta Systems (Honeywell)
- Tata Consultancy Services
- Thermo Fisher Scientific Inc. (PPD)
- United BioSource
- Wipro
Additional Benefits:
- The market estimate (ME) sheet in Excel format
- 3 months of analyst support
TABLE OF CONTENTS
1 Introduction
- 1.1 Study Assumptions & Market Definition
- 1.2 Scope of the Study
2 Research Methodology
3 Executive Summary
4 Market Landscape
- 4.1 Market Overview
- 4.2 Market Drivers
- 4.2.1 Rising Volume & Complexity of Safety Data
- 4.2.2 Regulatory Push for Real-Time Monitoring
- 4.2.3 Cost Pressure to Automate Case Processing
- 4.2.4 Social-Listening NLP for Patient-Reported Outcomes
- 4.2.5 Foundation Models for Rare-Disease Signal Detection
- 4.2.6 Federated Learning Agreements with EHR Exchanges
- 4.3 Market Restraints
- 4.3.1 Data-Privacy / Cross-Border Transfer Rules
- 4.3.2 Scarcity of Labeled Safety Datasets
- 4.3.3 Algorithmic Opacity Vs Regulatory Defensibility
- 4.3.4 High Compute Cost of Genai Inference
- 4.4 Value / Supply-Chain Analysis
- 4.5 Regulatory Landscape
- 4.6 Technological Outlook
- 4.7 Porter's Five Forces Analysis
- 4.7.1 Threat of New Entrants
- 4.7.2 Bargaining Power of Suppliers
- 4.7.3 Bargaining Power of Buyers
- 4.7.4 Threat of Substitutes
- 4.7.5 Competitive Rivalry
5 Market Size & Growth Forecasts (Value, USD)
- 5.1 By Component
- 5.1.1 Software Platforms
- 5.1.2 Services
- 5.2 By Deployment Model
- 5.2.1 Cloud-Based
- 5.2.2 On-Premise
- 5.3 By Application
- 5.3.1 Adverse Event Case Processing
- 5.3.2 Signal Detection & Prioritisation
- 5.3.3 Risk Management & Mitigation
- 5.3.4 Regulatory Reporting & Submissions
- 5.4 By End User
- 5.4.1 Pharmaceutical & Biotech Companies
- 5.4.2 Contract Research Organizations (CROs)
- 5.4.3 Medical Device Manufacturers
- 5.4.4 Regulatory Authorities
- 5.5 By Geography
- 5.5.1 North America
- 5.5.1.1 United States
- 5.5.1.2 Canada
- 5.5.1.3 Mexico
- 5.5.2 Europe
- 5.5.2.1 Germany
- 5.5.2.2 United Kingdom
- 5.5.2.3 France
- 5.5.2.4 Italy
- 5.5.2.5 Spain
- 5.5.2.6 Rest of Europe
- 5.5.3 Asia-Pacific
- 5.5.3.1 China
- 5.5.3.2 India
- 5.5.3.3 Japan
- 5.5.3.4 South Korea
- 5.5.3.5 Australia
- 5.5.3.6 Rest of Asia-Pacific
- 5.5.4 Middle East & Africa
- 5.5.4.1 GCC
- 5.5.4.2 South Africa
- 5.5.4.3 Rest of Middle East and Africa
- 5.5.5 South America
- 5.5.5.1 Brazil
- 5.5.5.2 Argentina
- 5.5.5.3 Rest of South America
- 5.5.1 North America
6 Competitive Landscape
- 6.1 Market Concentration
- 6.2 Market Share Analysis
- 6.3 Company Profiles (includes Global level Overview, Market-level Overview, Core Segments, Financials, Strategic Information, Market Rank/Share, Products & Services, Recent Developments)
- 6.3.1 AB Cube
- 6.3.2 Accenture
- 6.3.3 Anju Software
- 6.3.4 ArisGlobal
- 6.3.5 Capgemini
- 6.3.6 Clario (formerly BioClinica)
- 6.3.7 Cloudbyz
- 6.3.8 Cognizant
- 6.3.9 Ennov
- 6.3.10 Genpact
- 6.3.11 IBM Merative
- 6.3.12 IQVIA
- 6.3.13 Oracle
- 6.3.14 Parexel
- 6.3.15 Sparta Systems (Honeywell)
- 6.3.16 Tata Consultancy Services
- 6.3.17 Thermo Fisher Scientific Inc. (PPD)
- 6.3.18 United BioSource Corporation
- 6.3.19 Wipro
7 Market Opportunities & Future Outlook
- 7.1 White-Space & Unmet-Need Assessment

