
PUBLISHER: Mordor Intelligence | PRODUCT CODE: 2064535

PUBLISHER: Mordor Intelligence | PRODUCT CODE: 2064535
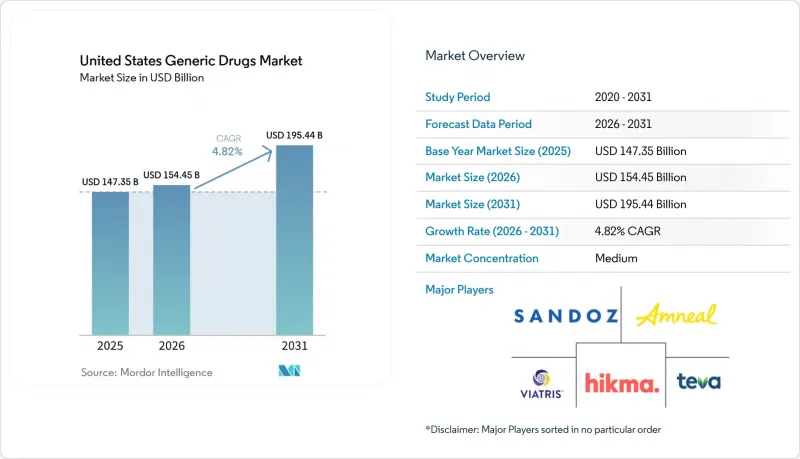
United States Generic Drugs - Market Share Analysis, Industry Trends & Statistics, Growth Forecasts (2026 - 2031)
According to Mordor Intelligence, the united states generic drugs market size is projected to be USD 147.35 billion in 2025, USD 154.45 billion in 2026, and reach USD 195.44 billion by 2031, growing at a CAGR of 4.82% from 2026 to 2031.
This report is Segmented by Brand Status (Unbranded, Branded Generics), Molecule Type (Small Molecule, Biosimilars), Therapeutic Area (Cardiovascular, CNS, Endocrine, Oncology, Respiratory, Anti-Infectives, Other), Route of Administration (Oral, Injectable, Topical, Inhalation, Other), and Distribution Channel (Retail, Hospital, Online, Specialty Pharmacy). Forecasts are Provided in Terms of Value (USD).
United States Generic Drugs Market Trends and Insights
Patent-Loss Wave in Cardiometabolic and CNS Brands: Blockbuster Volume Multiplies Rapidly
The near-term pipeline for the United States generic drugs market is being supported by a new cluster of patent-loss events in cardiometabolic and CNS therapies. These molecules sit inside large chronic treatment pools, so generic entry can shift very high prescription volumes in a short period once exclusivity ends. The effect is stronger when payer rules already favor rapid substitution and when prescribers are familiar with the underlying therapy class. This setup raises launch importance for companies that can file on time, secure manufacturing slots, and build early channel availability before markets become crowded. It also supports capacity utilization across oral solids and related supply networks, which makes this driver broader than a single product event. For the United States generic drugs market, this remains the clearest short-cycle volume trigger during the first half of the forecast period.
Payer Pressure for Low-Net-Cost Substitution: Mandates Intensify Beyond Voluntary Switching
Commercial insurers, pharmacy benefit managers, and public programs continue to push lower-net-cost substitution through prior authorization, formulary tiering, and step-edit rules. This matters because generic and biosimilar uptake now depends as much on reimbursement design as on product availability. In the United States, adalimumab biosimilars held 60% of the combined adalimumab market in March 2026, and ustekinumab biosimilars reached 27% share, showing how quickly uptake can move once payer alignment improves. The same reports also show that oncology, ophthalmology, and pegfilgrastim biosimilars have moved faster than immunology and insulin, which means payer economics are strongest where clinical substitution is already accepted. For the United States generic drugs market, this demand pull lowers the time between launch and meaningful volume capture. It also reinforces why commercial access teams matter almost as much as regulatory execution in the current cycle.
Persistent Multi-Source Price Erosion: A Structural Margin Drain That Suppresses Investment Return
Price erosion remains the most persistent structural restraint in the United States generic drugs market because mature molecules lose pricing power quickly after several competitors enter. Once that happens, volume growth often fails to translate into revenue growth at the same rate, which weakens returns on filings that looked attractive at launch. The problem is most severe in commodity oral solids, where substitution is easy and commercial differentiation is limited. Sandoz reported USD 7.8 billion in net sales for 2025 with 2% constant-currency growth, which illustrates how large volumes can still produce modest top-line momentum when price pressure remains intense. This environment pushes companies toward complex generics and biosimilars, but not every firm has the capital or technical base to make that transition at speed. The result is a United States generic drugs market in which operating discipline matters as much as launch success.
Other drivers and restraints analyzed in the detailed report include:
- Faster ANDA Review under GDUFA III: First-Cycle Rates Signal a Persistent Gap
- Expansion of Complex Injectables and Device-Linked Generics: Margin Recovery Vehicle for Generic Manufacturers
- PBM Specialty-Generic Markups Distorting Uptake: A Market Efficiency Failure with Policy Implications
For complete list of drivers and restraints, kindly check the Table Of Contents.
Segment Analysis
Unbranded generics held 82.31% of the United States generic drugs market share in 2025, which shows how firmly substitution rules are embedded across U.S. dispensing channels. This segment remains the basic operating core of the United States generic drugs market because payers, providers, and pharmacies are already organized around lower-cost substitution at scale. Commercial health plans and government programs have built decades of formulary behavior around these products, so demand is broad rather than concentrated in a few therapeutic classes. That gives unbranded portfolios a stabilizing role even when molecule-level pricing weakens after new competition arrives. It also explains why large manufacturers continue to treat broad portfolio coverage as a defensive asset rather than just a volume business.
The branded generic segment is smaller, but it is forecast to grow at 5.38% CAGR through 2031, which makes it the faster-moving opportunity in this split. Growth is being supported by authorized generic launches, reformulations, device-linked presentations, and other product variations that delay full commoditization. In practice, branded generics can create a short earnings window when a product enters the market with limited competition and stronger channel recognition. That window narrows once multiple producers enter and pricing resets, but it still matters for firms that can sequence launches around the loss-of-exclusivity calendar. The United States generic drugs industry is therefore treating branded generics less as a permanent share pool and more as a timed profitability event. Within the United States generic drugs market, this creates a two-speed structure in which volume sits with unbranded products while near-term margin opportunities often emerge in branded formats.
Small molecule generics accounted for 85.24% of the market in 2025, which reflects the long-standing dominance of tablets, capsules, and other familiar prescription formats. This share gives the United States generic drugs market a large and resilient volume base that is closely tied to chronic-disease prescribing patterns. Many near-term launches in cardiometabolic, CNS, endocrine, and anti-infective therapy still flow through this part of the market. The segment also benefits from established manufacturing systems, broad pharmacy stocking behavior, and a regulatory pathway that is well understood by experienced filers. Even so, the category faces its heaviest pressure in molecules that attract dense filing activity and rapid multi-source competition.
Biosimilars are projected to grow at 7.52% CAGR through 2031, making them the strongest growth engine by molecule type in the United States generic drugs market. The expanding biosimilar opportunity is already visible in the commercialization pace, with 92 FDA-cleared biosimilars across 20 molecules and 67 U.S. launches by March 2026. Samsung Bioepis also noted that the FDA's draft and revised guidance in late 2025 and early 2026 signaled greater flexibility around comparative efficacy expectations and non-U.S. comparator use, which could shorten development timelines for future programs. That does not mean every biologic loss-of-exclusivity event will have an immediate biosimilar response, because development remains expensive and technically selective. The United States generic drugs industry still faces a meaningful execution threshold under the biosimilar user fee and launch planning framework. Even so, the United States generic drugs market is steadily shifting from a small-molecule story toward a mixed small-molecule and biologics substitution story.
List of Companies Covered in this Report:
- Accord Healthcare, Inc.
- Alvogen, Inc.
- Amneal Pharmaceuticals
- ANI Pharmaceuticals
- Apotex
- Aurobindo Pharma
- Cipla
- Dr. Reddy's Laboratories
- Fresenius
- Glenmark Pharmaceuticals
- Hikma Pharmaceuticals
- Lupin
- Par Pharmaceutical, an Endo company
- Pfizer Inc. (Hospira sterile injectables)
- Sandoz Group AG
- Sun Pharmaceuticals Industries
- Teva Pharmaceutical Industries
- Torrent Pharmaceuticals Limited
- Viatris
- Zydus Lifesciences Limited
Additional Benefits:
- The market estimate (ME) sheet in Excel format
- 3 months of analyst support
TABLE OF CONTENTS
1 Introduction
- 1.1 Study Assumptions & Market Definition
- 1.2 Scope of the Study
2 Research Methodology
3 Executive Summary
4 Market Landscape
- 4.1 Market Overview
- 4.2 Market Drivers
- 4.2.1 Patent-Loss Wave in Cardiometabolic and CNS Brands
- 4.2.2 Payer Pressure for Low-Net-Cost Substitution
- 4.2.3 Faster ANDA Review Under GDUFA III
- 4.2.4 Expansion of Complex Injectables and Device-Linked Generics
- 4.2.5 Model-Integrated Evidence in Bioequivalence Packages
- 4.2.6 U.S.-Manufacturing Prioritization for Domestic Supply
- 4.3 Market Restraints
- 4.3.1 Persistent Multi-Source Price Erosion
- 4.3.2 Nitrosamine Testing and Reformulation Burden
- 4.3.3 PBM Specialty-Generic Markups Distorting Uptake
- 4.3.4 Retail Pharmacy Closures Reducing Substitution Throughput
- 4.4 Value Chain Analysis
- 4.5 Regulatory Landscape
- 4.6 Technological Outlook
- 4.7 Porter's Five Forces Analysis
- 4.7.1 Threat of New Entrants
- 4.7.2 Bargaining Power of Buyers
- 4.7.3 Bargaining Power of Suppliers
- 4.7.4 Threat of Substitutes
- 4.7.5 Competitive Rivalry
5 Market Size & Growth Forecasts (Value, USD)
- 5.1 By Brand Status
- 5.1.1 Unbranded Generics
- 5.1.2 Branded Generics
- 5.2 By Molecule Type
- 5.2.1 Small Molecule Generics
- 5.2.2 Biosimilars
- 5.3 By Therapeutic Area
- 5.3.1 Cardiovascular
- 5.3.2 Central Nervous System
- 5.3.3 Endocrine and Metabolic
- 5.3.4 Oncology
- 5.3.5 Respiratory
- 5.3.6 Anti-infectives
- 5.3.7 Other Therapeutic Areas
- 5.4 By Route of Administration
- 5.4.1 Oral
- 5.4.2 Injectable
- 5.4.3 Topical and Dermal
- 5.4.4 Inhalation
- 5.4.5 Other Routes of Administration
- 5.5 By Distribution Channel
- 5.5.1 Retail Pharmacies
- 5.5.2 Hospital Pharmacies
- 5.5.3 Online Pharmacies
- 5.5.4 Specialty Pharmacies
6 Competitive Landscape
- 6.1 Market Concentration
- 6.2 Market Share Analysis
- 6.3 Company Profiles (includes Global level Overview, Market level overview, Core Segments, Financials as available, Strategic Information, Market Rank/Share for key companies, Products & Services, and Recent Developments)
- 6.3.1 Accord Healthcare, Inc.
- 6.3.2 Alvogen, Inc.
- 6.3.3 Amneal Pharmaceuticals, Inc.
- 6.3.4 ANI Pharmaceuticals, Inc.
- 6.3.5 Apotex Inc.
- 6.3.6 Aurobindo Pharma Limited
- 6.3.7 Cipla Limited
- 6.3.8 Dr. Reddy's Laboratories Limited
- 6.3.9 Fresenius Kabi AG
- 6.3.10 Glenmark Pharmaceuticals Limited
- 6.3.11 Hikma Pharmaceuticals PLC
- 6.3.12 Lupin Limited
- 6.3.13 Par Pharmaceutical, an Endo company
- 6.3.14 Pfizer Inc. (Hospira sterile injectables)
- 6.3.15 Sandoz Group AG
- 6.3.16 Sun Pharmaceutical Industries Limited
- 6.3.17 Teva Pharmaceutical Industries Ltd.
- 6.3.18 Torrent Pharmaceuticals Limited
- 6.3.19 Viatris Inc.
- 6.3.20 Zydus Lifesciences Limited
7 Market Opportunities & Future Outlook
- 7.1 White-space & Unmet-need Assessment

