PUBLISHER: Mordor Intelligence | PRODUCT CODE: 2097199

PUBLISHER: Mordor Intelligence | PRODUCT CODE: 2097199
Generic Drugs - Market Share Analysis, Industry Trends & Statistics, Growth Forecasts (2026 - 2031)
According to Mordor Intelligence, the generic drugs market size is projected to expand from USD 419.37 billion in 2025 and USD 445.32 billion in 2026 to USD 571.12 billion by 2031, registering a CAGR of 5.11% between 2026 to 2031.
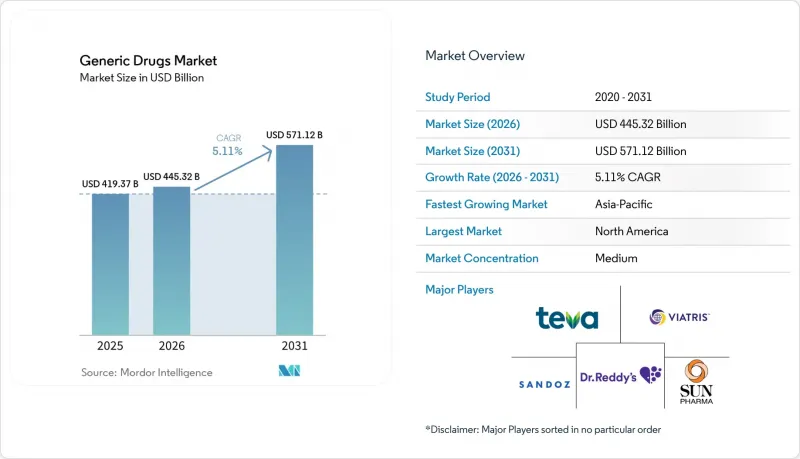
This report is Segmented by Drug Type (Simple Generics, Specialty Generics, Biosimilars, Complex Generics), Therapeutic Area (Cardiovascular, and More), Route of Administration (Oral, Injectable, and More), Distribution Channel (Retail Pharmacies, and More), and Geography (North America, Europe, Asia-Pacific, Middle East & Africa, South America). The Market Forecasts are Provided in Terms of Value (USD).
Global Generic Drugs Market Trends and Insights
Expiry of Blockbuster Drug Patents Post-2026
Patent expiries scheduled between 2026 and 2028 are expected to release approximately USD 40 billion in annual branded revenue to the generic drugs market. Sitagliptin, apixaban, dabigatran, and ticagrelor top the list, and first-to-file applicants can capture up to 70% of originator volume within six months. Formularies now impose 30-day substitution rules once exclusivity lapses, shrinking brand-loyalty windows. As diabetes, anticoagulation, and cardiovascular categories lose exclusivity, procurement budgets worth USD 15 billion are expected to shift to generic suppliers by 2028.
Escalating Pressure on Healthcare Budgets
The U.S. Centers for Medicare & Medicaid Services cut negotiated prices for 10 high-spend drugs by 38%-79% for 2026 implementation, reinforcing payer preference for low-cost therapies. European authorities maintain reference-pricing frameworks, while emerging markets extend tender cycles to secure deeper discounts. In the Asia-Pacific region, government bulk-purchase programs deliver savings exceeding 50% of pre-tender prices, redirecting funds toward hospital infrastructure upgrades. These measures decrease branded spend and allocate larger volumes to generics across high-prevalence chronic diseases.
Severe Price Erosion from Intense Competition
Generic prices fall by 90% when four or more entrants launch simultaneously, a pattern observed across 200 molecules from 2020 to 2024. Medicare's negotiated pricing is expected to accelerate similar cuts at Medicaid and commercial payers, compressing atorvastatin U.S. retail prices to USD 0.03 per tablet by 2025. Exclusivity periods cushion early entrants, but widespread competition collapses margins within six months. Firms offset pressure by pivoting toward complex generics and biosimilars; however, each candidate requires USD 10 million-USD 50 million in development expenditures, thereby heightening portfolio risk.
Other drivers and restraints analyzed in the detailed report include:
- Favorable Government Initiatives & Reimbursement Policies
- Accelerated FDA ANDA Approvals Under GDUFA III
- Nitrosamine Impurity Compliance Costs
For complete list of drivers and restraints, kindly check the Table Of Contents.
Segment Analysis
Simple generics accounted for 62.31% of 2025 revenue, primarily driven by high-volume oral solids for the treatment of hypertension, diabetes, and hyperlipidemia. Biosimilars, led by eight adalimumab products capturing 45% of Humira's U.S. volume, will expand at a 6.89% CAGR through 2031. Specialty and complex generics require USD 10 million-USD 15 million in development investment yet preserve 40%-60% of reference pricing, offering margin stability when simple-generic prices approach marginal cost.
Interchangeability designations accelerate uptake in retail settings; Cyltezo's 2024 label expansion permits pharmacy-level substitution without prescriber intervention, driving broader access. Medicare Advantage plans now require biosimilar dispensing in 80% of eligible prescriptions, while commercial plans stand at 50% due to rebate contracts that favor reference biologics. As payers align formularies with cost-containment goals, the generic drugs market benefits from an expanding biosimilar pipeline covering autoimmune, oncology, and metabolic therapies.
Cardiovascular agents retained 56.73% revenue share in 2025 as decades-old statins and beta-blockers continue to serve rising chronic-disease prevalence. Oncology, however, is projected to record a 7.34% CAGR, the fastest among therapeutic categories, driven by bevacizumab, trastuzumab, and rituximab biosimilar penetration. Oncology additions strengthen the generic drugs market share in hospital formularies, where biosimilars reduce chemotherapy costs by up to USD 200,000 per patient annually.
FDA approvals for generic imatinib, erlotinib, and nilotinib in 2024 added USD 3 billion in reference-product volume to the substitution pipeline. Hospitals readily adopt oncology biosimilars that maintain infusion-center workflows and earn payer coverage. In contrast, anti-infective growth is tempered by stewardship programs, while CNS drugs trade near marginal cost, leaving minimal room for new entrants. Respiratory generics gain traction through inhalable technologies, with fluticasone-salmeterol and budesonide-formoterol inhalers projecting robust volume growth.
Complete Report Scope:
- By Drug Type
- Simple Generics
- Specialty Generics
- Biosimilars
- Complex Generics
- By Therapeutic Area
- Cardiovascular
- Oncology
- Anti-Infective
- Central Nervous System
- Endocrine/Metabolic
- Respiratory
- Others
- By Route of Administration
- Oral
- Injectable
- Topical
- Inhalable
- Other Route of Administration
- By Distribution Channel
- Retail Pharmacies
- Hospital Pharmacies
- Online Pharmacies
- Other Distribution Channel
- By Geography
- North America
- United States
- Canada
- Mexico
- Europe
- Germany
- United Kingdom
- France
- Italy
- Spain
- Rest of Europe
- Asia-Pacific
- China
- Japan
- India
- Australia
- South Korea
- Rest of Asia-Pacific
- Middle East & Africa
- GCC
- South Africa
- Rest of Middle East & Africa
- South America
- Brazil
- Argentina
- Rest of South America
- North America
Geography Analysis
North America secured 42.76% revenue in 2025, underpinned by Medicare Part D and Medicaid purchasing power. The FDA authorized 76 first-generation generics in 2024, releasing USD 8 billion in branded sales for substitution. Canada's price review board trimmed ceiling prices for 15 drugs, lessening cross-border arbitrage. Mexico's COFEPRIS cut bioequivalence review times to 10 months, strengthening regional supply. Over the forecast period, U.S. Inflation Reduction Act negotiations are expected to widen from 10 to 60 drugs, thereby magnifying payer leverage and reinforcing the adoption of generics.
The Asia-Pacific region is projected to record a 7.89% CAGR through 2031, representing the fastest regional growth in the generic drugs market. India's USD 2 billion Production-Linked Incentive stimulates API self-reliance, while China's consistency evaluations consolidate manufacturers around those with clinical-trial capacity. Japan lifted substitution targets to 85% by 2025, and Australia's Pharmaceutical Benefits Scheme added 120 molecules in 2024, expanding access. These policy shifts accelerate approvals and deepen penetration across rapidly growing chronic disease segments.
Europe maintains stable growth through cost-containment tools, such as Germany's AMNOG reference pricing and France's biosimilar quotas, which mandate 80% substitution for adalimumab by 2025. EMA cleared 45 generics and biosimilars in 2024, including ustekinumab and bevacizumab products worth EUR 3 billion in reference sales. Middle East and Africa markets adopt the WHO prequalification to diversify procurement, while South Africa prioritized HIV and tuberculosis generics in Global Fund tenders. South America benefits from Brazil's shortened bioequivalence timelines; however, Argentina's macroeconomic volatility prompts local firms to fill supply gaps.
- Alvogen
- Apotex
- Aurobindo Pharma Ltd.
- Cipla
- Dr. Reddy's Laboratories Ltd.
- Endo International
- Fresenius
- Glenmark Pharmaceuticals
- Hikma Pharmaceuticals
- KRKA d.d.
- Lupin
- Nichi-Iko Pharmaceutical Co., Ltd.
- Sandoz Group AG
- Sawai Pharmaceutical Co., Ltd.
- Stada Arzneimittel
- Sun Pharmaceuticals Industries
- Teva Pharmaceutical Industries
- Torrent Pharmaceuticals
- Viatris
- Zydus Lifesciences Ltd.
Additional Benefits:
- The market estimate (ME) sheet in Excel format
- 3 months of analyst support
TABLE OF CONTENTS
1 Introduction
- 1.1 Study Assumptions & Market Definition
- 1.2 Scope of the Study
2 Research Methodology
3 Executive Summary
4 Market Landscape
- 4.1 Market Overview
- 4.2 Market Drivers
- 4.2.1 Expiry of Blockbuster Drug Patents Post-2026
- 4.2.2 Escalating Pressure on Healthcare Budgets
- 4.2.3 Favorable Government Initiatives & Reimbursement Policies
- 4.2.4 Accelerated FDA ANDA Approvals Under GDUFA III
- 4.2.5 Rise of Complex Generics (Drug-Device Combinations)
- 4.2.6 AI-Driven Bioequivalence Modeling Shortening Development Cycles
- 4.3 Market Restraints
- 4.3.1 Severe Price Erosion from Intense Competition
- 4.3.2 Supply-Chain Quality Issues & Product Recalls
- 4.3.3 API Manufacturing Concentration Outside Asia
- 4.3.4 Nitrosamine Impurity Compliance Costs
- 4.4 Regulatory Landscape
- 4.5 Technological Outlook
- 4.6 Porter's Five Forces Analysis
- 4.6.1 Threat of New Entrants
- 4.6.2 Bargaining Power of Buyers
- 4.6.3 Bargaining Power of Suppliers
- 4.6.4 Threat of Substitutes
- 4.6.5 Competitive Rivalry
5 Market Size & Growth Forecasts
- 5.1 By Drug Type
- 5.1.1 Simple Generics
- 5.1.2 Specialty Generics
- 5.1.3 Biosimilars
- 5.1.4 Complex Generics
- 5.2 By Therapeutic Area
- 5.2.1 Cardiovascular
- 5.2.2 Oncology
- 5.2.3 Anti-Infective
- 5.2.4 Central Nervous System
- 5.2.5 Endocrine/Metabolic
- 5.2.6 Respiratory
- 5.2.7 Others
- 5.3 By Route of Administration
- 5.3.1 Oral
- 5.3.2 Injectable
- 5.3.3 Topical
- 5.3.4 Inhalable
- 5.3.5 Other Route of Administration
- 5.4 By Distribution Channel
- 5.4.1 Retail Pharmacies
- 5.4.2 Hospital Pharmacies
- 5.4.3 Online Pharmacies
- 5.4.4 Other Distribution Channel
- 5.5 By Geography
- 5.5.1 North America
- 5.5.1.1 United States
- 5.5.1.2 Canada
- 5.5.1.3 Mexico
- 5.5.2 Europe
- 5.5.2.1 Germany
- 5.5.2.2 United Kingdom
- 5.5.2.3 France
- 5.5.2.4 Italy
- 5.5.2.5 Spain
- 5.5.2.6 Rest of Europe
- 5.5.3 Asia-Pacific
- 5.5.3.1 China
- 5.5.3.2 Japan
- 5.5.3.3 India
- 5.5.3.4 Australia
- 5.5.3.5 South Korea
- 5.5.3.6 Rest of Asia-Pacific
- 5.5.4 Middle East & Africa
- 5.5.4.1 GCC
- 5.5.4.2 South Africa
- 5.5.4.3 Rest of Middle East & Africa
- 5.5.5 South America
- 5.5.5.1 Brazil
- 5.5.5.2 Argentina
- 5.5.5.3 Rest of South America
- 5.5.1 North America
6 Competitive Landscape
- 6.1 Market Concentration
- 6.2 Market Share Analysis
- 6.3 Company Profiles (includes Global level Overview, Market-level Overview, Core Segments, Financials, Strategic Information, Market Rank/Share, Products & Services, Recent Developments)
- 6.3.1 Alvogen
- 6.3.2 Apotex Inc.
- 6.3.3 Aurobindo Pharma Ltd.
- 6.3.4 Cipla Ltd.
- 6.3.5 Dr. Reddy's Laboratories Ltd.
- 6.3.6 Endo International plc
- 6.3.7 Fresenius Kabi AG
- 6.3.8 Glenmark Pharmaceuticals Ltd.
- 6.3.9 Hikma Pharmaceuticals plc
- 6.3.10 KRKA d.d.
- 6.3.11 Lupin Ltd.
- 6.3.12 Nichi-Iko Pharmaceutical Co., Ltd.
- 6.3.13 Sandoz Group AG
- 6.3.14 Sawai Pharmaceutical Co., Ltd.
- 6.3.15 STADA Arzneimittel AG
- 6.3.16 Sun Pharmaceutical Industries Ltd.
- 6.3.17 Teva Pharmaceutical Industries Ltd.
- 6.3.18 Torrent Pharmaceuticals Ltd.
- 6.3.19 Viatris Inc.
- 6.3.20 Zydus Lifesciences Ltd.
7 Market Opportunities & Future Outlook
- 7.1 White-space & Unmet-need Assessment

