
PUBLISHER: Mordor Intelligence | PRODUCT CODE: 2065588

PUBLISHER: Mordor Intelligence | PRODUCT CODE: 2065588
South America IT Device - Market Share Analysis, Industry Trends & Statistics, Growth Forecasts (2026 - 2031)
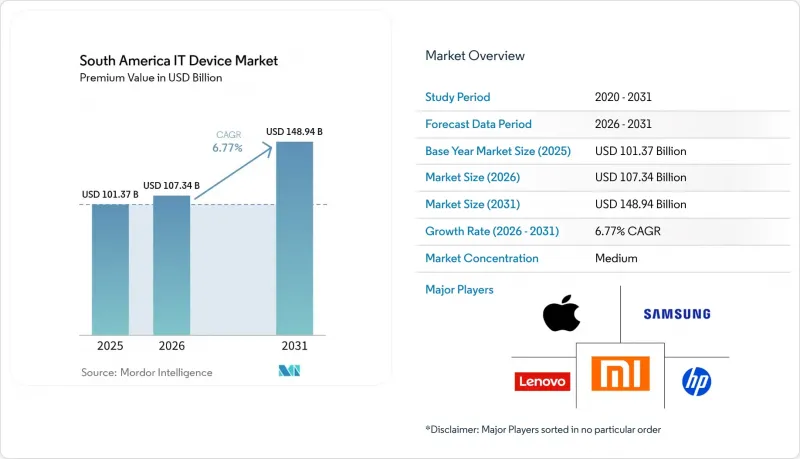
According to Mordor Intelligence, the south america iT device market size was valued at USD 101.37 billion in 2025 and estimated to grow from USD 107.34 billion in 2026 to reach USD 148.94 billion by 2031, at a CAGR of 6.77% during the forecast period (2026-2031).
This report is Segmented by Device Type (Smartphones, Tablets, Laptops and Notebooks, Desktops and Workstations, and Wearables), End-User Industry (Consumer, Enterprise, and More), Distribution Channel (Online Retailers, Omnichannel Retailers, and More), Price Band (Budget <=USD 200, Mid-Range USD 201-600, and Premium >=USD 601), and Geography. The Market Forecasts are Provided in Terms of Value (USD).
South America IT Device Market Trends and Insights
Expanding Middle-Class Smartphone Penetration
Rising disposable incomes in Brazil, Mexico, and Colombia are converting feature phone users into smartphone owners, lifting mobile internet penetration to 84% in Brazil in 2025. Secondary cities posted double-digit shipment gains as 4G coverage expanded to 92% of households and carriers bundled entry-level 5G handsets at below USD 200. Samsung's Galaxy A07 5G debut in Peru in 2026 illustrates how vendors compress costs to target first-time upgraders. Remittance inflows of USD 63.3 billion into Mexico funded premium upgrades, pushing devices above MXN 10,000 (approximately USD 588) to a 17.1% share in Q3 2025. Together, these trends enlarge the addressable base for the South America IT device market.
Shift to Remote and Hybrid Work Boosting PC and Tablet Demand
Corporate hardware budgets pivoted to notebooks and tablets as hybrid work became entrenched, lifting Brazil's ICT hardware outlays to USD 43.2 billion in 2024, or 48% of total ICT spend. Enterprises now request AI-accelerated chipsets that enable on-device translation and noise suppression, and Lenovo's 2026 tie-up with Positivo to deploy Spark AI workstations underscores the emphasis on edge compute. Rugged tablets are also proliferating in field services, reinforcing device diversity across the South America IT device market.
Currency Volatility and Inflation Eroding Consumer Purchasing Power
Argentina's peso fell 54% against the dollar in 2024, while Brazil's real swung within a 15% band, escalating import costs for both components and finished goods. Inflation averaged 7.2% in Colombia during 2025, squeezing discretionary budgets and stretching smartphone replacement cycles from 24 to 30 months. Brazil's sweeping tax overhaul under Complementary Law 214 introduced pricing uncertainty that retailers passed on to consumers, and cross-border shopping surged as buyers exploited duty-free thresholds in Paraguay and Chile. These dynamics restrain near-term unit growth for the South America IT device market
Other drivers and restraints analyzed in the detailed report include:
- E-commerce Growth Accelerating Online Device Sales
- Manaus Free Trade Zone Tax Incentives Enabling Local Assembly Lines
- High Import Tariffs on Finished Electronics
For complete list of drivers and restraints, kindly check the Table Of Contents.
Segment Analysis
Wearables have been gaining significant traction, even though smartphones continue to dominate the South America IT device market, accounting for 53.76% of the revenue in 2025. The growing adoption of wearables is being driven by innovative insurance programs in countries like Brazil and Colombia, where insurers now offer premium rebates of 10-15% to customers who agree to share their biometric data. This trend is expected to drive a compound annual growth rate (CAGR) of 7.77% for the wearables category through 2031. Major players such as Samsung, Huawei, and Amazfit have introduced affordable trackers priced under USD 100, equipped with advanced features like heart-rate monitoring and SpO2 sensors, during the 2024-2026 period. Meanwhile, Xiaomi has strategically positioned its Watch 5 at a price point of MXN 5,000 (approximately USD 294) to encourage users to transition from basic fitness bands to fully featured smartwatches.
In addition to wearables, tablets and 2-in-1 notebooks have also witnessed increased demand, particularly as hybrid work models continue to expand across the region. Enterprises are increasingly specifying devices with stylus support to meet the needs of field workers, further driving their adoption. While desktops remain a niche segment, they continue to hold steady demand in specialized environments such as design studios and public agencies, where their performance and reliability are critical. As health-monitoring incentives become more widespread and regulatory frameworks for over-the-counter diagnostics become clearer, the wearables segment in the South America IT device market is expected to gradually close the gap with smartphones, solidifying its position as a key growth driver in the region.
Consumers accounted for 65.12% of 2025 spending, primarily driven by the surge in smartphone purchases during holiday promotions. The consumer segment continues to dominate the market as individuals increasingly prioritize personal devices for communication, entertainment, and productivity. However, corporate demand is also on the rise, advancing at an annual growth rate of 7.37%. This growth is reshaping procurement habits, with businesses opting for bundled solutions that include enhanced security features, managed services, and AI-ready endpoints to meet evolving operational needs. Lenovo, for instance, has capitalized on this trend by offering multi-year frameworks that combine hardware with on-site support services. This strategic approach has enabled Lenovo to secure over 20% of the South America IT device market share in the PC segment.
Government and education orders are also witnessing significant growth, particularly in Colombia, where a national initiative aims to equip 10,000 schools with tablets by 2027. This program underscores the increasing role of technology in education and the government's commitment to bridging the digital divide. However, fiscal austerity measures in Argentina have constrained large-scale deployments, highlighting regional disparities in public-sector investment. Meanwhile, enterprises across South America are increasingly viewing IT devices as critical compliance tools, especially under Brazil's LGPD (General Data Protection Law). Businesses are prioritizing devices with advanced features, such as biometric authentication and remote wipe capabilities, to ensure data security and regulatory compliance. These preferences are driving up device average selling prices, further influencing the dynamics of the South America IT device market.
List of Companies Covered in this Report:
- Samsung Electronics Co., Ltd.
- Apple Inc.
- Lenovo Group Limited
- HP Inc.
- Dell Technologies Inc.
- ASUSTeK Computer Inc.
- Acer Inc.
- Huawei Technologies Co., Ltd.
- Xiaomi Corporation
- Sony Group Corporation
- LG Electronics Inc.
- ZTE Corporation
- Hon Hai Precision Industry Co., Ltd.
- HTC Corporation
- TCL Technology Group Corporation
- Transsion Holdings Co., Ltd.
- BBK Electronics Corporation Limited
- Positivo Tecnologia S.A.
- Multilaser Industrial S.A.
- Compal Electronics, Inc.
Additional Benefits:
- The market estimate (ME) sheet in Excel format
- 3 months of analyst support
TABLE OF CONTENTS
1 INTRODUCTION
- 1.1 Study Assumptions and Market Definition
- 1.2 Scope of the Study
2 RESEARCH METHODOLOGY
3 EXECUTIVE SUMMARY
4 MARKET LANDSCAPE
- 4.1 Market Overview
- 4.2 Market Drivers
- 4.2.1 Expanding Middle-Class Smartphone Penetration
- 4.2.2 Shift to Remote and Hybrid Work Boosting PC and Tablet Demand
- 4.2.3 E-commerce Growth Accelerating Online Device Sales
- 4.2.4 Manaus Free Trade Zone Tax Incentives Enabling Local Assembly Lines
- 4.2.5 PIX Instant-Pay Installment Scheme Unlocking High-Ticket Device Purchases
- 4.2.6 Semiconductor Supply Diversification Mitigating Price Volatility
- 4.3 Market Restraints
- 4.3.1 Currency Volatility and Inflation Eroding Consumer Purchasing Power
- 4.3.2 High Import Tariffs on Finished Electronics
- 4.3.3 Memory Supply Crunch Raising Average Selling Prices
- 4.3.4 Gray-Market Devices Undercutting Official Channels
- 4.4 Impact of Macroeconomic Factors on the Market
- 4.5 Industry Value Chain Analysis
- 4.6 Regulatory Landscape
- 4.7 Technological Outlook
- 4.8 Porter's Five Forces Analysis
- 4.8.1 Bargaining Power of Suppliers
- 4.8.2 Bargaining Power of Buyers
- 4.8.3 Threat of New Entrants
- 4.8.4 Threat of Substitutes
- 4.8.5 Intensity of Competitive Rivalry
5 MARKET SIZE AND GROWTH FORECASTS (VALUE)
- 5.1 By Device Type
- 5.1.1 Smartphones
- 5.1.2 Tablets
- 5.1.3 Laptops and Notebooks
- 5.1.4 Desktops and Workstations
- 5.1.5 Wearables
- 5.2 By End-User Industry
- 5.2.1 Consumer
- 5.2.2 Enterprise
- 5.2.3 Government and Education
- 5.3 By Distribution Channel
- 5.3.1 Online Retailers
- 5.3.2 Omnichannel Retailers
- 5.3.3 Brand-owned Stores
- 5.3.4 Multi-brand Physical Outlets
- 5.4 By Price Band
- 5.4.1 Budget (<= USD 200)
- 5.4.2 Mid-range (USD 201-600)
- 5.4.3 Premium (>= USD 601)
- 5.5 By Geography
- 5.5.1 Brazil
- 5.5.2 Mexico
- 5.5.3 Argentina
- 5.5.4 Colombia
- 5.5.5 Rest of South America
6 COMPETITIVE LANDSCAPE
- 6.1 Market Concentration
- 6.2 Strategic Moves
- 6.3 Market Share Analysis
- 6.4 Company Profiles (includes Global Level Overview, Market Level Overview, Core Segments, Financials as available, Strategic Information, Market Rank/Share, Products and Services, Recent Developments)
- 6.4.1 Samsung Electronics Co., Ltd.
- 6.4.2 Apple Inc.
- 6.4.3 Lenovo Group Limited
- 6.4.4 HP Inc.
- 6.4.5 Dell Technologies Inc.
- 6.4.6 ASUSTeK Computer Inc.
- 6.4.7 Acer Inc.
- 6.4.8 Huawei Technologies Co., Ltd.
- 6.4.9 Xiaomi Corporation
- 6.4.10 Sony Group Corporation
- 6.4.11 LG Electronics Inc.
- 6.4.12 ZTE Corporation
- 6.4.13 Hon Hai Precision Industry Co., Ltd.
- 6.4.14 HTC Corporation
- 6.4.15 TCL Technology Group Corporation
- 6.4.16 Transsion Holdings Co., Ltd.
- 6.4.17 BBK Electronics Corporation Limited
- 6.4.18 Positivo Tecnologia S.A.
- 6.4.19 Multilaser Industrial S.A.
- 6.4.20 Compal Electronics, Inc.
7 MARKET OPPORTUNITIES AND FUTURE OUTLOOK
- 7.1 White-Space and Unmet-Need Assessment

