
PUBLISHER: Mordor Intelligence | PRODUCT CODE: 2065595

PUBLISHER: Mordor Intelligence | PRODUCT CODE: 2065595
Asia-Pacific Gaming GPU - Market Share Analysis, Industry Trends & Statistics, Growth Forecasts (2026 - 2031)
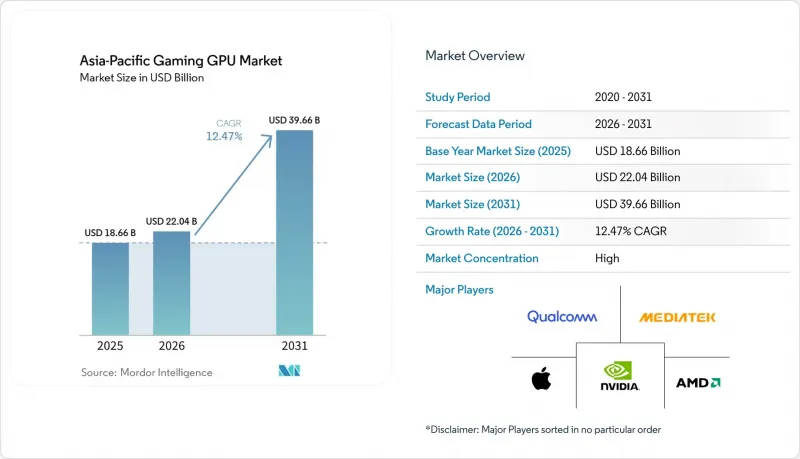
According to Mordor Intelligence, the asia-Pacific gaming GPU market size is expected to grow from USD 18.66 billion in 2025 to USD 22.04 billion in 2026 and is forecast to reach USD 39.66 billion by 2031 at 12.47% CAGR over 2026-2031.
This report is Segmented by GPU Type (Discrete GPUs, and Integrated GPUs), Device Type (Gaming Desktops, Gaming Laptops, and Smartphones and Tablets (Mobile Gaming)), End-User Type (Casual Gamers, and Enthusiast and Professional Gamers), Memory Type (GDDR6, GDDR6X, Other Memory Types, and Unified Memory), and Country. The Market Forecasts are Provided in Terms of Value (USD).
Asia-Pacific Gaming GPU Market Trends and Insights
Esports Prize Pools And Campus Leagues Expanding GPU Upgrade Cycles
Structured esports competition is acting as a hardware demand engine across the region, especially through campus formats that make high-performance gaming more visible to students. OPPO's Hyper Legend Cup x Mobile Legends Bang Bang Campus Series 2026 drew more than 1,400 team registrations across Indonesia, the Philippines, Malaysia, and Singapore, and the prize pool reached USD 100,000, up from USD 52,000 in the prior cycle. Acer's Predator League Asia-Pacific 2026 also reinforced this pattern, because a regional event with teams from more than 14 APAC territories gave sponsored hardware stronger visibility among players and spectators. As prize structures become more formal, buyers start to view GPU upgrades as a practical requirement for training and competition rather than a discretionary purchase. That effect is especially relevant in the Asia-Pacific gaming GPU market, where first exposure to premium gaming hardware often happens in school labs, tournaments, and organized gaming venues.
AI Upscaling And Frame Generation Raising Mid-Tier GPU Utility
AI upscaling has changed the value equation for mid-range gaming cards, especially in markets where buyers compare frame output closely against total system cost. NVIDIA introduced DLSS 4.5 in 2026 with a second-generation transformer model for super resolution and a 6x Multi Frame Generation mode for GeForce RTX 50 Series GPUs NVIDIA.COM. AMD answered in May 2026 by extending FSR 4 hardware-accelerated upscaling to older RDNA 3 and RDNA 3.5 products, including the Radeon RX 7000 series, with rollout starting in July. This shift delays replacement for some casual buyers, because existing hardware can now deliver better image quality and frame rates through software improvements. At the same time, it accelerates upgrades among enthusiasts in the Asia-Pacific gaming GPU market, because the newest frame generation features still require current-generation hardware to unlock their full value.
Export Controls On Advanced GPUs And Interconnects
Export controls remain the clearest structural risk to the Asia-Pacific gaming GPU market because they narrow product availability and reshape regional supply priorities. The U.S. Bureau of Industry and Security issued a final rule on January 15, 2026, that revised export licensing for advanced computing semiconductors to China and Macau under stricter compliance conditions. Even when gaming products are not the direct target, changes in certification and review requirements affect the same supply chains used by board partners, OEMs, and channel distributors. This makes the premium end of the China business less predictable and can shift volumes toward lower-tier products or non-China markets. The result is a more uneven regional growth pattern, with high-end availability increasingly shaped by compliance rules rather than only by consumer demand.
Other drivers and restraints analyzed in the detailed report include:
- Cloud Gaming Rollouts Broadening Access To High-Fidelity Play
- Premium Mobile SoCs Bringing Hardware Ray Tracing To Mobile Games
- Advanced Packaging And VRAM Tightness Inflating Board Costs
For complete list of drivers and restraints, kindly check the Table Of Contents.
Segment Analysis
Discrete GPUs are projected to advance at a 13.02% CAGR from 2026 to 2031, which keeps them at the center of the Asia-Pacific gaming GPU market. Their position remains strong in premium and mainstream PC gaming because competitive play, higher refresh displays, and AI-led rendering features still require more graphics headroom than integrated solutions can usually provide. The segment also benefits from the organized PC gaming culture in several APAC countries, where gaming venues and heavy-use players refresh systems more often than casual households. That pattern supports repeat demand even when entry-tier consumer spending becomes uneven.
NVIDIA's Blackwell generation, including the GeForce RTX 5090 and RTX 5080, introduced in January 2025, lifted the performance ceiling for gaming systems and raised expectations for new hardware cycles. NVIDIA reported fiscal 2025 revenue of USD 130.5 billion, up 114% year over year, with gaming remaining the largest contributor within its Graphics segment alongside a rapidly scaling data center business. Integrated GPUs are gaining more ground at the low end of the Asia-Pacific gaming GPU industry, because newer client processors have narrowed the performance gap for entry gaming and mixed-use laptops. AMD reported Client and Gaming revenue of USD 3.6 billion in the first quarter of 2026, up 23% year over year, but it also warned that gaming demand would face pressure from higher memory and component costs later in the year.
Gaming desktops held 45.61% of the Asia-Pacific gaming GPU market size in 2025, which reflected the region's strong base of dedicated gaming setups, esports venues, and upgradable systems. Desktops continue to benefit from modular upgrades, because buyers can replace the graphics card without replacing the full device. That lowers refresh costs for individuals and for institutional buyers such as gaming cafes, training centers, and local esports venues. In the Asia-Pacific gaming GPU market, this replacement model keeps desktop demand durable even when premium flagship cards move out of reach for many buyers.
Gaming laptops are forecast to expand at a 12.98% CAGR from 2026 to 2031, and that pace shows how quickly portable performance is improving. ASUS announced the Zephyrus Duo in January 2026 as a 16-inch dual-screen OLED gaming laptop with up to an NVIDIA GeForce RTX 5090 Laptop GPU at 135W TGP, which showed how close premium mobile systems had moved toward desktop-class performance expectations. ASUS also introduced refreshed Zephyrus G14 and G16 models with Intel, AMD, and NVIDIA options, which widened the choice set for buyers seeking portability without leaving the high-performance bracket. Smartphones, tablets, and handheld PCs remain important to the Asia-Pacific gaming GPU industry, but their economics differ because premium SoCs and integrated graphics platforms drive more of their value than discrete add-in boards.
List of Companies Covered in this Report:
- NVIDIA Corporation
- Advanced Micro Devices, Inc.
- Qualcomm Technologies, Inc.
- Intel Corporation
- MediaTek Inc.
- Apple Inc.
- Moore Threads
- Samsung Electronics Co., Ltd.
- ASUSTeK Computer Inc.
- Micro-Star INT'L CO., LTD.
- ZOTAC Technology Limited
- Palit Microsystems Ltd.
- SAPPHIRE Technology Limited
- TUL Corporation
- Acer Inc.
- Lenovo Group Limited
- Dell Inc.
- HP Development Company, L.P.
- Razer Inc.
- ASRock Inc.
Additional Benefits:
- The market estimate (ME) sheet in Excel format
- 3 months of analyst support
TABLE OF CONTENTS
1 INTRODUCTION
- 1.1 Study Assumptions and Market Definition
- 1.2 Scope of the Study
2 RESEARCH METHODOLOGY
3 EXECUTIVE SUMMARY
4 MARKET LANDSCAPE
- 4.1 Market Overview
- 4.2 Impact of Macroeconomic Factors on the Market
- 4.3 Market Drivers
- 4.3.1 Esports Prize Pools and Campus Leagues Expanding GPU Upgrade Cycles
- 4.3.2 AI Upscaling and Frame Generation Raising Mid-Tier GPU Utility
- 4.3.3 Cloud Gaming Rollouts Broadening Access to High-Fidelity Play
- 4.3.4 Premium Mobile SoCs Bringing Hardware Ray Tracing to Mobile Games
- 4.3.5 Handheld PC Spillover Lifting Demand for Laptop-Class GPUs
- 4.3.6 China Localization Efforts Diversifying Gaming GPU Supply
- 4.4 Market Restraints
- 4.4.1 Export Controls on Advanced GPUs and Interconnects
- 4.4.2 Advanced Packaging and VRAM Tightness Inflating Board Costs
- 4.4.3 Integrated and Unified Memory Designs Compressing Entry-Tier Demand
- 4.4.4 Power and Thermal Limits in Compact Gaming Devices
- 4.5 Industry Value Chain Analysis
- 4.6 Regulatory Landscape
- 4.7 Technological Outlook
- 4.8 Porter's Five Forces Analysis
- 4.8.1 Threat of New Entrants
- 4.8.2 Bargaining Power of Suppliers
- 4.8.3 Bargaining Power of Buyers
- 4.8.4 Threat of Substitutes
- 4.8.5 Competitive Rivalry
5 MARKET SIZE AND GROWTH FORECASTS (VALUE)
- 5.1 By GPU Type
- 5.1.1 Discrete GPUs
- 5.1.2 Integrated GPUs
- 5.2 By Device Type
- 5.2.1 Gaming Desktops
- 5.2.2 Gaming Laptops
- 5.2.3 Smartphones and Tablets (Mobile Gaming)
- 5.3 By End-User Type
- 5.3.1 Casual Gamers
- 5.3.2 Enthusiast and Professional Gamers
- 5.4 By Memory Type
- 5.4.1 GDDR6
- 5.4.2 GDDR6X
- 5.4.3 Legacy Graphics Memory
- 5.4.4 Unified Memory
6 COMPETITIVE LANDSCAPE
- 6.1 Market Concentration
- 6.2 Strategic Moves
- 6.3 Market Share Analysis
- 6.4 Company Profiles (includes Global Level Overview, Market Level Overview, Core Segments, Financials as available, Strategic Information, Market Rank/Share, Products and Services, Recent Developments)
- 6.4.1 NVIDIA Corporation
- 6.4.2 Advanced Micro Devices, Inc.
- 6.4.3 Qualcomm Technologies, Inc.
- 6.4.4 Intel Corporation
- 6.4.5 MediaTek Inc.
- 6.4.6 Apple Inc.
- 6.4.7 Moore Threads
- 6.4.8 Samsung Electronics Co., Ltd.
- 6.4.9 ASUSTeK Computer Inc.
- 6.4.10 Micro-Star INT'L CO., LTD.
- 6.4.11 ZOTAC Technology Limited
- 6.4.12 Palit Microsystems Ltd.
- 6.4.13 SAPPHIRE Technology Limited
- 6.4.14 TUL Corporation
- 6.4.15 Acer Inc.
- 6.4.16 Lenovo Group Limited
- 6.4.17 Dell Inc.
- 6.4.18 HP Development Company, L.P.
- 6.4.19 Razer Inc.
- 6.4.20 ASRock Inc.
7 MARKET OPPORTUNITIES AND FUTURE OUTLOOK
- 7.1 White-Space and Unmet-Need Assessment

