
PUBLISHER: Mordor Intelligence | PRODUCT CODE: 2065771

PUBLISHER: Mordor Intelligence | PRODUCT CODE: 2065771
Home Decor - Market Share Analysis, Industry Trends & Statistics, Growth Forecasts (2026 - 2031)
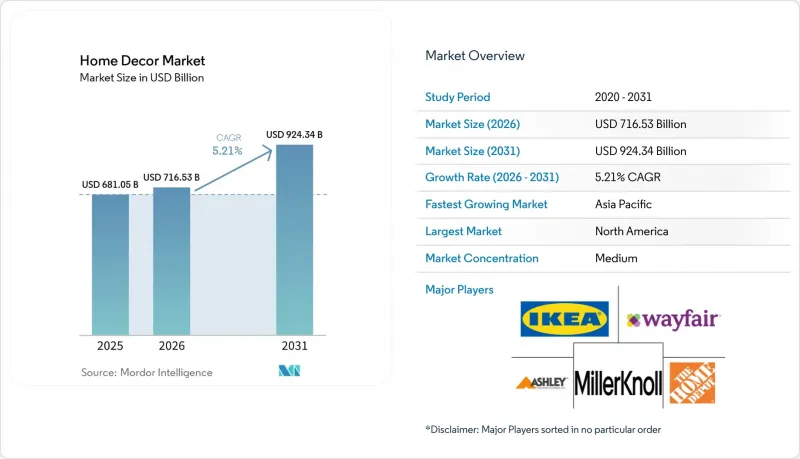
According to Mordor Intelligence, the home decor market size is expected to grow from USD 681.05 billion in 2025 to USD 716.53 billion in 2026 and is forecast to reach USD 924.34 billion by 2031 at 5.21% CAGR over 2026-2031.
This report is Segmented by Product (Furniture, Textiles, and More), by Distribution Channel (Specialty Stores, DIY / Mass Merchandiser, Online, and More), by Price Tier (Mass / Value, Premium, Luxury / Designer) and by Geography (North America, Europe, Asia-Pacific, South America, Middle East & Africa). The Market Forecasts are Provided in Terms of Value (USD).
Global Home Decor Market Trends and Insights
Rising Consumer Interest in Interior Design and Aesthetics
Premiumization has moved from niche aspiration to mainstream expectation as households allocate larger portions of discretionary income to elevate interior spaces. Williams-Sonoma posted a Q4 2024 operating margin of 21.5% and a 3.1% comparable brand sales increase, confirming that design-centric positioning retains pricing power even in mixed macro conditions. Mass-oriented retailers, led by Home Depot, expanded their decor assortments to meet this design appetite, even though furnishings still account for only 4% of the chain's USD 152 billion revenue base. Trade journals highlight 2025-2026 style themes that pair natural palettes with personalized accents, echoing consumer desire for meaningful products over legacy brand prestige. Gen Z singles out authenticity, sustainable origin, and multipurpose functionality, turning the home decor market into a canvas for self-expression that extends beyond traditional furniture purchases.
Growing Influence of Social Media and Digital Platforms
Visual-first channels compress the traditional discovery funnel: consumers spot a trend, validate it through peer content, and complete a purchase in minutes, often from a smartphone. Wayfair disclosed that 63% of its Q3 2024 orders arrived via mobile devices, and IKEA U.S. reported USD 1.9 billion in online revenue against USD 5.5 billion total sales, McKinsey found that more than half of consumers in Germany and the U.K. shop for home decor online, yet only one-fifth of SMEs sell through digital channels, leaving a sizable fulfillment gap that agile brands are beginning to fill. Fast-moving dynamics reward manufacturers capable of "drop" style launches that keep pace with social feeds, while extended development cycles risk shelving products that are no longer on trend.
Raw-Material Price Volatility
Commodity swings create headline risk and margin erosion in the home decor market. Lumber prices climbed 16% year-over-year in May 2025 to USD 450 per thousand board feet. Tariffs amplify turbulence: Canadian softwood duties have lifted costs by up to 80%, while broader steel and aluminum tariffs added USD 2.5 billion in annual expenses across 463 construction inputs. Ocean freight spikes above USD 20,000 per container during supply chain crises have forced retailers to reassess sourcing footprints. Large players lock in long-term contracts or invest in upstream assets, whereas small and mid-size brands often absorb higher costs or risk lost shelf space if they attempt price increases. The situation pressures the sector to rethink material substitution, near-shoring, and collaborative procurement as viable hedging tactics.
Other drivers and restraints analyzed in the detailed report include:
- Shift Toward Eco-Friendly and Sustainable Materials
- Expansion of Smart-Home Compatible Decor
- Skilled Artisanal Labor Shortage
For complete list of drivers and restraints, kindly check the Table Of Contents.
Segment Analysis
Floor coverings held 35.72% of the home decor market share in 2025 on the back of renovation cycles, builder demand, and their relatively high ticket value. Textile items, meanwhile, are projected to expand the home decor market size for soft furnishings at a 7.28% CAGR through 2031, lifted by shorter replacement cycles and social-media-influenced styling. Consumers regard throw pillows, rugs, and curtains as low-risk tools for rapid room refreshment, which sustains frequent purchase intervals. By contrast, floor installations and upgrades often coincide with life events such as property acquisition or major remodels, ensuring large basket values but lower transaction velocity. Lowe's USD 1.325 billion acquisition of Artisan Design Group highlights the strategic value of turnkey flooring solutions that bundle product, installation, and after-sales services.
A secondary product shift is unfolding in decorative accessories, wall art, and lighting. These smaller hardware items complement textiles to transform spaces without structural change. Manufacturers that unite a cohesive palette across categories improve cart conversions, as shoppers prefer streamlined color matches. Meanwhile, lighting upgrades intersect with smart-home adoption; voice-controlled bulbs and fixtures raise attachment rates for connected hubs. Floor covering vendors respond with under-floor heating compatibility, indicating a convergence of comfort, energy efficiency, and design. As category boundaries blur, retailers curate room-in-a-box bundles that simplify decision-making and raise the overall average order value across the home decor market.
Geography Analysis
North America's 41.98% home decor market share in 2025 rests on mature housing stock, high household incomes, and a cultural affinity for DIY improvements. Builder confidence, while moderating, still supports annual single-family housing starts near 927,000 units despite recent declines. Tariff-driven material inflation challenges profitability, so retailers hedge by contracting local mills and extending private-label lines that carry higher margins. Technology uptake remains robust: AR visualization apps have become table stakes, and connected-home penetration fosters cross-selling of smart-compatible decor. Sustainability is also gaining ground as state regulations on recycling and energy efficiency converge with consumer values, nudging suppliers to certify lumber and upholster with recycled fibers.
Asia-Pacific is the fastest riser, projected to deliver an 8.11% CAGR through 2031 and steadily close the gap with the current regional leader. India exemplifies demand momentum: its home and interior business climbed to USD 29.5 billion in 2023 and is expected to reach USD 48.1 billion by 2028 on an 11.4% furnishings CAGR. A young demographic profile, rapid urban growth, and widespread smartphone adoption create fertile ground for social-commerce-led discovery. Regional e-tailers such as HomeLane amplify growth by acquiring rivals like Design Cafe to scale design-to-installation offerings. China remains the dominant sourcing hub, but rising labor and compliance costs spur multinational brands to diversify toward Vietnam and Indonesia. Currency volatility, however, makes hedging strategies indispensable for maintaining stable landed costs.
Europe remains pivotal for sustainability leadership even as macro uncertainty tempers spending. The EU Green Deal's forthcoming mandatory eco-design rules pressure firms to adopt circular strategies, from product passports to take-back logistics. Consumers increasingly favor brands that provide transparent carbon footprints, pushing marketing narratives to shift from style alone to style backed by science. Logistics-savvy players circumvent cross-border return costs by partnering with local refinishers who refurbish and resell returned items, cutting waste while improving margins.
- Inter IKEA Systems B.V.
- Home Depot Product Authority LLC
- Wayfair Inc.
- Ashley Global Retail LLC
- MillerKnoll Inc.
- Williams-Sonoma Inc. (Pottery Barn, West Elm)
- Mohawk Industries Inc.
- Mannington Mills Inc.
- Shaw Industries Group Inc.
- La-Z-Boy Incorporated
- RH (Restoration Hardware)
- Ethan Allen Interiors Inc.
- Haverty Furniture Companies Inc.
- Crate & Barrel Holdings Inc.
- Lowe's Companies Inc.
- Walmart Inc. (Home & Living)
- Target Corporation (Threshold, Hearth & Hand)
- At Home Group Inc.
- Overstock.com Inc.*
Additional Benefits:
- The market estimate (ME) sheet in Excel format
- 3 months of analyst support
TABLE OF CONTENTS
1 Introduction
- 1.1 Study Assumptions and Market Definition
- 1.2 Scope of the Study
2 Research Methodology
3 Executive Summary
4 Market Landscape
- 4.1 Market Overview
- 4.2 Market Drivers
- 4.2.1 Rising consumer interest in interior design and aesthetics
- 4.2.2 Growing influence of social media and digital platforms
- 4.2.3 Shift toward eco-friendly and sustainable materials
- 4.2.4 Expansion of smart-home compatible decor
- 4.2.5 Urban micro-living spurring multifunctional furniture
- 4.2.6 Emerging "phygital" AR/VR showroom adoption
- 4.3 Market Restraints
- 4.3.1 Raw-material price volatility
- 4.3.2 Skilled artisanal labor shortage
- 4.3.3 Costly cross-border e-commerce returns
- 4.3.4 Stricter EPR / take-back mandates
- 4.4 Value / Supply-Chain Analysis
- 4.5 Regulatory Landscape
- 4.6 Technological Outlook
- 4.7 Porter's Five Forces
- 4.7.1 Threat of New Entrants
- 4.7.2 Bargaining Power of Buyers
- 4.7.3 Bargaining Power of Suppliers
- 4.7.4 Threat of Substitutes
- 4.7.5 Intensity of Competitive Rivalry
5 Market Size & Growth Forecasts
- 5.1 By Product
- 5.1.1 Furniture
- 5.1.2 Textiles (Curtains, Bedding, Cushions)
- 5.1.3 Floor Coverings
- 5.1.4 Wall Decor and Accessories
- 5.1.5 Lighting
- 5.2 By Distribution Channel
- 5.2.1 Specialty Stores
- 5.2.2 DIY / Mass Merchandiser
- 5.2.3 Online / E-commerce
- 5.2.4 Interior Designers and Contractors
- 5.3 By Price Tier
- 5.3.1 Mass / Value
- 5.3.2 Premium
- 5.3.3 Luxury / Designer
- 5.4 By Geography (Value)
- 5.4.1 North America
- 5.4.1.1 Canada
- 5.4.1.2 United States
- 5.4.1.3 Mexico
- 5.4.2 South America
- 5.4.2.1 Brazil
- 5.4.2.2 Peru
- 5.4.2.3 Chile
- 5.4.2.4 Argentina
- 5.4.2.5 Rest of South America
- 5.4.3 Europe
- 5.4.3.1 United Kingdom
- 5.4.3.2 Germany
- 5.4.3.3 France
- 5.4.3.4 Spain
- 5.4.3.5 Italy
- 5.4.3.6 BENELUX (Belgium, Netherlands, Luxembourg)
- 5.4.3.7 NORDICS (Denmark, Finland, Iceland, Norway, Sweden)
- 5.4.3.8 Rest of Europe
- 5.4.4 Asia-Pacific
- 5.4.4.1 India
- 5.4.4.2 China
- 5.4.4.3 Japan
- 5.4.4.4 Australia
- 5.4.4.5 South Korea
- 5.4.4.6 South East Asia (Singapore, Malaysia, Thailand, Indonesia, Vietnam, and Philippines)
- 5.4.4.7 Rest of Asia-Pacific
- 5.4.5 Middle East & Africa
- 5.4.5.1 United Arab Emirates
- 5.4.5.2 Saudi Arabia
- 5.4.5.3 South Africa
- 5.4.5.4 Nigeria
- 5.4.5.5 Rest of Middle East & Africa
- 5.4.1 North America
6 Competitive Landscape
- 6.1 Market Concentration
- 6.2 Strategic Moves
- 6.3 Market Share Analysis
- 6.4 Company Profiles (includes Global level Overview, Market level overview, Core Segments, Financials as available, Strategic Information, Market Rank/Share for key companies, Products & Services, and Recent Developments)
- 6.4.1 Inter IKEA Systems B.V.
- 6.4.2 Home Depot Product Authority LLC
- 6.4.3 Wayfair Inc.
- 6.4.4 Ashley Global Retail LLC
- 6.4.5 MillerKnoll Inc.
- 6.4.6 Williams-Sonoma Inc. (Pottery Barn, West Elm)
- 6.4.7 Mohawk Industries Inc.
- 6.4.8 Mannington Mills Inc.
- 6.4.9 Shaw Industries Group Inc.
- 6.4.10 La-Z-Boy Incorporated
- 6.4.11 RH (Restoration Hardware)
- 6.4.12 Ethan Allen Interiors Inc.
- 6.4.13 Haverty Furniture Companies Inc.
- 6.4.14 Crate & Barrel Holdings Inc.
- 6.4.15 Lowe's Companies Inc.
- 6.4.16 Walmart Inc. (Home & Living)
- 6.4.17 Target Corporation (Threshold, Hearth & Hand)
- 6.4.18 At Home Group Inc.
- 6.4.19 Overstock.com Inc.*
7 Market Opportunities & Future Outlook
- 7.1 White-space & Unmet-need Assessment

