
PUBLISHER: Mordor Intelligence | PRODUCT CODE: 2066376

PUBLISHER: Mordor Intelligence | PRODUCT CODE: 2066376
Dry-Type Transformer - Market Share Analysis, Industry Trends & Statistics, Growth Forecasts (2026 - 2031)
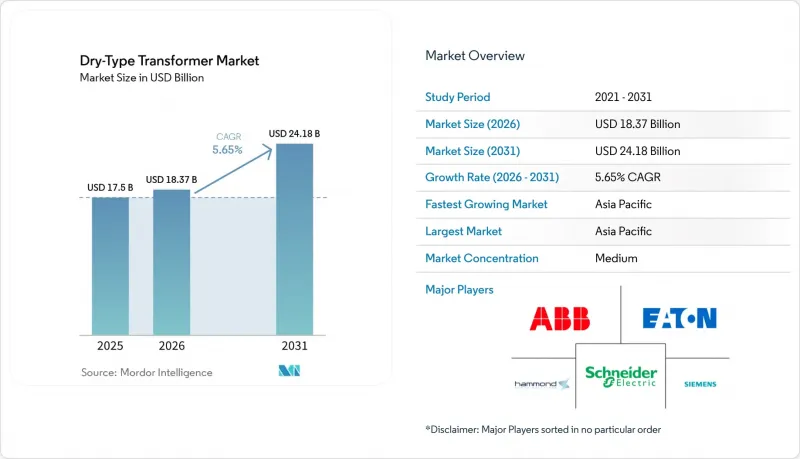
According to Mordor Intelligence, the dry-Type transformer market size is expected to grow from USD 17.5 billion in 2025 to USD 18.37 billion in 2026 and is forecast to reach USD 24.18 billion by 2031 at 5.65% CAGR over 2026-2031.
This report is Segmented by Power Rating (Large, Medium, and Small), Cooling Method (Air-Natural, Air-Forced, and Water-Forced), Phase (Single-Phase and Three-Phase), Transformer Type (Power and Distribution), End-User (Power Utilities, Industrial, Commercial, and Residential), and Geography (North America, Europe, Asia-Pacific, South America, and Middle East and Africa).
Global Dry-Type Transformer Market Trends and Insights
Increasing Grid-Edge Medium-Voltage Replacements
Half of North America's distribution-transformer fleet now exceeds 33 years in service, driving a replacement wave that favors dry-type units in wildfire-prone regions. Utilities are pairing transformers with battery storage and solar inverters, demanding K-factor designs above 13 to handle harmonic-rich loads. Pad-mounted configurations cut installation costs by 15-20% because they eliminate oil-containment vaults, and California regulators are accelerating adoption through stringent wildfire-mitigation mandates. Globally, the resulting volume supports economies of scale that lower per-kVA pricing and widen the addressable dry-type transformers market. Suppliers integrating sensors for harmonic distortion and temperature are capturing premium margins as utilities pivot toward condition-based maintenance.
Surge in Renewable-Tied Pad-Mounted Installations
Global renewable capacity additions are forecast to create cumulative step-up demand of 2 TW by 2050. Dry-type pad-mounted units sidestep costly spill-containment berms, shaving up to 12 weeks from construction schedules in environmentally sensitive zones. Offshore wind developers are standardizing IP56-rated cast-coil designs that withstand salt spray, while integrated energy-storage projects require bidirectional transformers capable of cyclical charge-discharge regimes. Product launches such as Eaton's Envirotran series underscore the shift, and the trend lifts both unit volume and average selling price, reinforcing a robust growth outlook for the dry-type transformers market.
Volatile Copper & Epoxy Prices
LME copper peaked at USD 11,104.50 per tonne in 2024, lifting material costs for windings that account for up to 40% of a transformer's bill of materials. Epoxy resin tracked oil derivatives higher, squeezing margins on cast-coil designs. Manufacturers reduced price-validity windows to 30-45 days and inserted escalation clauses, pushing commodity risk onto end-users. Aluminum windings gained favor for low-voltage coils, trimming weight by 60% yet demanding larger conductors to match conductivity. Smaller Asian vendors without hedging tools faced order cancellations, a drag on the dry-type transformers market in price-sensitive tenders.
Other drivers and restraints analyzed in the detailed report include:
- Data-Center Fire-Safety Mandates Favoring Oil-Free Units
- Electrification of Offshore Platforms
- Lengthening LV & MV Transformer Lead-Times
For complete list of drivers and restraints, kindly check the Table Of Contents.
Segment Analysis
Small ratings up to 10 MVA accounted for 68.8% of the dry-type transformers market share in 2025. They are projected to grow at 8.6% as rooftop solar, EV-charging hubs, and battery storage expand. The dry-type transformers market size for this class is forecast at USD 16.7 billion by 2031. Medium-power units between 10 MVA and 100 MVA follow with modest uptake in university campuses and industrial complexes, increasingly specified with on-load tap changers for renewable intermittency.
Containerized data-center modules favor 2-5 MVA dry-type blocks, cutting on-site work from 12 weeks to three. Large-MVA step-up requirements remain niche because oil-immersed cooling still delivers better thermal economics at the 400 MVA level. Upcoming U.S. efficiency rules mandate amorphous-core adoption in small distribution units, temporarily inflating capex but improving lifecycle cost, reinforcing momentum in the dry-type transformers market.
Air-natural designs held 70.7% share in 2025, thanks to simplicity and silent operation. Yet air-forced cooling is advancing at 8.9% CAGR as data-center and industrial retrofits demand higher power density. Variable-speed fans controlled by embedded processors cut auxiliary draw by 50% versus fixed-speed models. Water-forced alternatives surface in Saudi Arabia and Abu Dhabi, where 45 °C ambient temperatures erode air-cooling efficiency; despite niche adoption, their higher price lifts the overall dry-type transformers market size.
Asia-Pacific leads air-forced uptake given land constraints in cities like Singapore and Mumbai. Meanwhile, air-natural retains a foothold in hospitals and schools that require low acoustic profiles.
Geography Analysis
Asia-Pacific led global revenue with 48.1% share in 2025 and is forecast to grow at 6.7% CAGR. China's State Grid is adding more than 200 GW of renewable capacity annually, each gigawatt requiring dozens of dry-type step-up units, while India's Production-Linked Incentive scheme subsidizes local transformer output. Earthquake-resistant versions in Japan and South Korea use flexible bushings to meet seismic codes, underscoring regional customization within the dry-type transformers market.
North America ranks second in size but posts the fastest growth, buoyed by USD 369 billion in Inflation Reduction Act spending and USD 65 billion in infrastructure funding. California utilities specify dry-type units in wildfire corridors, and coastal operators replace oil-filled gear vulnerable to storm-surge contamination. Growing data-center clusters in Virginia and Texas drive further demand for harmonic-rated, fire-safe transformers.
Europe's REPowerEU initiative accelerates offshore wind deployment. Dry-type transformers step up 66 kV cables to 220 kV shoreside grids, sidestepping oil-spill risks. The Middle East and Africa confront thermal derating penalties above 45 °C; water-forced cooling mitigates the issue, albeit at 30% capital cost premiums. Brazil and Chile anchor Latin American growth through hydro-solar hybrids needing dry-type step-ups. Collectively, these dynamics reinforce a geographically diverse dry-type transformers market.
- ABB Ltd.
- Eaton Corporation plc
- CG Power & Industrial Solutions
- TBEA Co. Ltd.
- MGM Transformer Co.
- Federal Pacific Transformer
- Temco Industrial Power
- Siemens AG
- Hitachi Energy Ltd.
- Fuji Electric Co. Ltd.
- Kirloskar Electric Co. Ltd.
- TMC Transformers S.p.A.
- LS Electric Co. Ltd.
- Gujarat Transformers Pvt Ltd.
- Schneider Electric SE
- Hammond Power Solutions Inc.
- Hyundai Electric & Energy Systems
- Bharat Bijlee Ltd.
- Voltamp Transformers Ltd.
- Daelim Co. Ltd.
- WEG SA
Additional Benefits:
- The market estimate (ME) sheet in Excel format
- 3 months of analyst support
TABLE OF CONTENTS
1 Introduction
- 1.1 Study Assumptions & Market Definition
- 1.2 Scope of the Study
2 Research Methodology
3 Executive Summary
4 Market Landscape
- 4.1 Market Overview
- 4.2 Market Drivers
- 4.2.1 Increasing grid-edge medium-voltage replacements
- 4.2.2 Surge in renewable-tied pad-mounted installations
- 4.2.3 Data-center fire-safety mandates favouring oil-free units
- 4.2.4 Electrification of offshore platforms (EPCI push)
- 4.2.5 AI-enabled remote condition monitoring
- 4.2.6 Polymer soft-magnetic composite cores lowering no-load loss
- 4.3 Market Restraints
- 4.3.1 Volatile copper & epoxy prices
- 4.3.2 Lengthening LV & MV transformer lead-times
- 4.3.3 Thermal derating above 45 C ambient in MENA
- 4.3.4 Certification bottlenecks for over 72.5 kV dry units
- 4.4 Supply-Chain Analysis
- 4.5 Regulatory Landscape
- 4.6 Technological Outlook
- 4.7 Porter's Five Forces
- 4.7.1 Bargaining Power of Suppliers
- 4.7.2 Bargaining Power of Buyers
- 4.7.3 Threat of New Entrants
- 4.7.4 Threat of Substitutes
- 4.7.5 Competitive Rivalry
5 Market Size & Growth Forecasts
- 5.1 By Power Rating
- 5.1.1 Large (Above 100 MVA)
- 5.1.2 Medium (10 to 100 MVA)
- 5.1.3 Small (Up to 10 MVA)
- 5.2 By Cooling Method
- 5.2.1 AN (Air-Natural)
- 5.2.2 AF (Air-Forced)
- 5.2.3 WF (Water-Forced)
- 5.3 By Phase
- 5.3.1 Single Phase
- 5.3.2 Three Phase
- 5.4 By Transformer Type
- 5.4.1 Power
- 5.4.2 Distribution
- 5.5 By End-User
- 5.5.1 Power Utilities
- 5.5.2 Industrial
- 5.5.3 Commercial
- 5.5.4 Residential
- 5.6 By Geography
- 5.6.1 North America
- 5.6.1.1 United States
- 5.6.1.2 Canada
- 5.6.1.3 Mexico
- 5.6.2 Europe
- 5.6.2.1 United Kingdom
- 5.6.2.2 Germany
- 5.6.2.3 France
- 5.6.2.4 Italy
- 5.6.2.5 Spain
- 5.6.2.6 Russia
- 5.6.2.7 Rest of Europe
- 5.6.3 Asia-Pacific
- 5.6.3.1 China
- 5.6.3.2 India
- 5.6.3.3 Japan
- 5.6.3.4 South Korea
- 5.6.3.5 ASEAN Countries
- 5.6.3.6 Australia and New Zealand
- 5.6.3.7 Rest of Asia-Pacific
- 5.6.4 South America
- 5.6.4.1 Brazil
- 5.6.4.2 Argentina
- 5.6.4.3 Chile
- 5.6.4.4 Rest of South America
- 5.6.5 Middle East and Africa
- 5.6.5.1 Saudi Arabia
- 5.6.5.2 United Arab Emirates
- 5.6.5.3 South Africa
- 5.6.5.4 Egypt
- 5.6.5.5 Rest of Middle East and Africa
- 5.6.1 North America
6 Competitive Landscape
- 6.1 Market Concentration
- 6.2 Strategic Moves (M&A, Partnerships, PPAs)
- 6.3 Market Share Analysis (Market Rank/Share for key companies)
- 6.4 Company Profiles (includes Global level Overview, Market level overview, Core Segments, Financials as available, Strategic Information, Products & Services, and Recent Developments)
- 6.4.1 ABB Ltd.
- 6.4.2 Eaton Corporation plc
- 6.4.3 CG Power & Industrial Solutions
- 6.4.4 TBEA Co. Ltd.
- 6.4.5 MGM Transformer Co.
- 6.4.6 Federal Pacific Transformer
- 6.4.7 Temco Industrial Power
- 6.4.8 Siemens AG
- 6.4.9 Hitachi Energy Ltd.
- 6.4.10 Fuji Electric Co. Ltd.
- 6.4.11 Kirloskar Electric Co. Ltd.
- 6.4.12 TMC Transformers S.p.A.
- 6.4.13 LS Electric Co. Ltd.
- 6.4.14 Gujarat Transformers Pvt Ltd.
- 6.4.15 Schneider Electric SE
- 6.4.16 Hammond Power Solutions Inc.
- 6.4.17 Hyundai Electric & Energy Systems
- 6.4.18 Bharat Bijlee Ltd.
- 6.4.19 Voltamp Transformers Ltd.
- 6.4.20 Daelim Co. Ltd.
- 6.4.21 WEG SA
7 Market Opportunities & Future Outlook
- 7.1 White-space & Unmet-Need Assessment

