
PUBLISHER: Mordor Intelligence | PRODUCT CODE: 2066401

PUBLISHER: Mordor Intelligence | PRODUCT CODE: 2066401
High Voltage Cables - Market Share Analysis, Industry Trends & Statistics, Growth Forecasts (2026 - 2031)
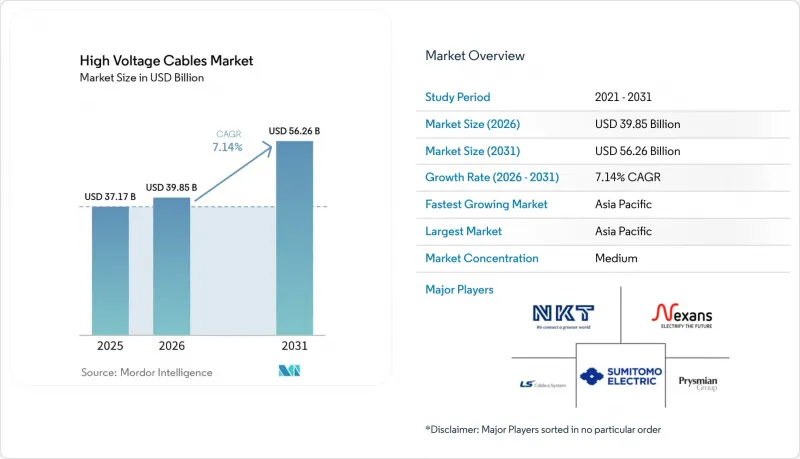
According to Mordor Intelligence, the high voltage cables market reached USD 39.85 billion in 2026 and is projected to achieve USD 56.26 billion by 2031, reflecting a 7.14% CAGR during the forecast period, underscoring a decisive reorientation of power-grid spending toward decarbonization and resilience.
This report is Segmented by Location of Deployment (Overhead Cables, Underground Cables, and Submarine Cables), Type of Transmission (HVDC and HVAC), Voltage Level (66 KV To 110KV, 115 KV To 330 KV, and Above 330 KV), and Geography (North America, Europe, Asia-Pacific, South America, and Middle East and Africa). The Market Size and Forecast are Provided in Value (USD).
Global High Voltage Cables Market Trends and Insights
Integration of renewable energy build-out
Curtailment risk is escalating as solar and wind additions outpace grid reinforcements, compelling governments to mandate new high-capacity corridors, such as the EU goal of 40,000 circuit-km by 2030. India cleared 8,000 km of 400 kV and 765 kV lines in 2025 to connect Rajasthan and Gujarat renewables, while China commissioned 3,200 km of +- 800 kV HVDC to move western power eastward. Storage co-location offers only four-hour coverage, leaving the high voltage cables market central to seasonal balancing strategies.
Rapid Grid Modernization & Interconnection Projects
Legacy circuits installed in the 1960s now show rising failure rates, and the U.S. Department of Energy committed USD 2.5 billion in 2025 to stimulate large interregional links. ASEAN's USD 800 billion Power Grid blueprint envisions synchronous exchanges across Thailand, Malaysia, Singapore, and Indonesia, while the 2 GW EuroAsia Interconnector will deploy 525 kV subsea cables to marry Mediterranean and European demand centers. These builds reinforce the long-run growth of the high-voltage cables market.
High Upfront CAPEX of HV Cable Projects
Submarine and underground routes cost up to five times more per km than overhead lines, with the Celtic Interconnector priced at EUR 1.6 million per km, straining debt-service metrics in developing countries. Rising interest rates in 2024-2025 pushed Prysmian's inquiry-to-order conversion down 30% as financiers balked at unhedged cost exposure.
Other drivers and restraints analyzed in the detailed report include:
- Expanding Offshore Wind Farm Installations
- Data-Center Campus Power-Density Surge
- Lengthy Permitting & Environmental Clearances
For complete list of drivers and restraints, kindly check the Table Of Contents.
Segment Analysis
Submarine lines are projected to grow 10.3% between 2026 and 2031, the fastest among deployment modes, catalyzed by offshore arrays in the North Sea, Taiwan Strait, and the U.S. Atlantic. Underground routes retained 48.1% of the high voltage cables market size in 2025, driven by dense urban centers that restrict overhead construction. Overhead circuits still dominate sparsely populated corridors in North America and Africa, leveraging easier rights-of-way and lower CAPEX. Vessel shortages mean developers must pre-book installation ships years ahead, an operational hurdle that shapes bid strategies.
Urban planners in Tokyo, Seoul, and Singapore favor underground feeder loops to address visual impact concerns. Conversely, the Celtic and Bornholm projects show how submarine architecture can aggregate multi-gigawatt wind hubs. The IEC 62067 standard for extruded insulation underpins procurement uniformity, while insurance costs escalate due to fishing-gear strike risks. These dynamics ensure the high voltage cables market continues reallocating capital from overhead to submarine corridors.
Geography Analysis
Asia-Pacific dominated the high voltage cables market with 40.0% share in 2025 and is rising at a 9.6% CAGR through 2031. China energized 3,200 km of +- 800 kV HVDC in 2025 to funnel western renewables eastward, while India approved 8,000 km of 400 kV and 765 kV corridors to connect solar zones. ASEAN's USD 800 billion grid program and Japan's 2 GW Akita-Noshiro offshore complex anchor further regional growth.
Europe ranks second, buoyed by offshore wind and cross-border HVDC pledges under the TEN-E framework. The North Sea Wind Power Hub's 70 GW plan requires 525 kV cables in meshed configurations; Germany's SuedLink alone spans 2,000 km of +- 525 kV underground route. Public resistance to overhead lines pushes utilities to pricier underground options, sustaining high voltage cables market value despite flat volume growth.
North America focuses on renewables integration and resilience. The TransWest Express +- 600 kV project broke ground in 2025, connecting Wyoming wind to Nevada and California over 730 miles, while Quebec's hydro exports demand 320 kV HVDC upgrades. The Middle East leverages surplus solar to plan the 3 GW Saudi-Greece interconnector, and South Africa accelerates 400 kV builds to stabilize Eskom's grid. South America advances 500 kV HVAC corridors across Brazil and Argentina, benefitting regional suppliers. These developments collectively amplify global appetite for high-voltage cables market solutions.
- Prysmian Group
- Nexans SA
- NKT A/S
- ABB Ltd
- Siemens Energy AG
- Southwire Company LLC
- LS Cable & System Ltd
- Sumitomo Electric Industries Ltd
- General Cable Corp (Prysmian)
- KEI Industries Ltd
- Furukawa Electric Co Ltd
- Taihan Cable & Solution
- Tratos Ltd
- Finolex Cables Ltd
- Cable Corporation of India Ltd
- Jiangsu Zhongtian Technology Co
- Dubai Cable Co (DUCAB)
- Gupta Power Infrastructure Ltd
- Elsewedy Electric
- Riyadh Cables Group
Additional Benefits:
- The market estimate (ME) sheet in Excel format
- 3 months of analyst support
TABLE OF CONTENTS
1 Introduction
- 1.1 Study Assumptions & Market Definition
- 1.2 Scope of the Study
2 Research Methodology
3 Executive Summary
4 Market Landscape
- 4.1 Market Overview
- 4.2 Market Drivers
- 4.2.1 Integration of renewable energy build-out
- 4.2.2 Rapid grid-modernisation & inter-connection projects
- 4.2.3 Expanding offshore-wind farm installations
- 4.2.4 Urbanisation & industrial load growth in emerging economies
- 4.2.5 Data-centre campus power-density surge
- 4.2.6 Hydrogen economy-ready transmission corridors
- 4.3 Market Restraints
- 4.3.1 High upfront CAPEX of HV cable projects
- 4.3.2 Lengthy permitting & environmental clearances
- 4.3.3 Commodity-price volatility (Cu, Al, polymers)
- 4.3.4 Shortage of certified HV jointing technicians
- 4.4 Supply-Chain Analysis
- 4.5 Regulatory Landscape
- 4.6 Technological Outlook
- 4.7 Porter's Five Forces
- 4.7.1 Bargaining Power of Suppliers
- 4.7.2 Bargaining Power of Buyers
- 4.7.3 Threat of New Entrants
- 4.7.4 Threat of Substitutes
- 4.7.5 Competitive Rivalry
5 Market Size & Growth Forecasts
- 5.1 By Location of Deployment
- 5.1.1 Overhead Cables
- 5.1.2 Underground Cables
- 5.1.3 Submarine Cables
- 5.2 By Type of Transmission
- 5.2.1 HVDC
- 5.2.2 HVAC
- 5.3 By Voltage Level
- 5.3.1 66 kV to 110 kV
- 5.3.2 115 kV to 330 kV
- 5.3.3 Above 330 kV
- 5.4 By Geography
- 5.4.1 North America
- 5.4.1.1 United States
- 5.4.1.2 Canada
- 5.4.1.3 Mexico
- 5.4.2 Europe
- 5.4.2.1 Germany
- 5.4.2.2 United Kingdom
- 5.4.2.3 France
- 5.4.2.4 Italy
- 5.4.2.5 Russia
- 5.4.2.6 Rest of Europe
- 5.4.3 Asia Pacific
- 5.4.3.1 China
- 5.4.3.2 India
- 5.4.3.3 Japan
- 5.4.3.4 South Korea
- 5.4.3.5 ASEAN Countries
- 5.4.3.6 Rest of Asia Pacific
- 5.4.4 South America
- 5.4.4.1 Brazil
- 5.4.4.2 Argentina
- 5.4.4.3 Rest of South America
- 5.4.5 Middle East and Africa
- 5.4.5.1 Saudi Arabia
- 5.4.5.2 United Arab Emirates
- 5.4.5.3 South Africa
- 5.4.5.4 Egypt
- 5.4.5.5 Rest of Middle East and Africa
- 5.4.1 North America
6 Competitive Landscape
- 6.1 Market Concentration
- 6.2 Strategic Moves (M&A, Partnerships, PPAs)
- 6.3 Market Share Analysis (Market Rank/Share for key companies)
- 6.4 Company Profiles (includes Global level Overview, Market level overview, Core Segments, Financials as available, Strategic Information, Products & Services, and Recent Developments)
- 6.4.1 Prysmian Group
- 6.4.2 Nexans SA
- 6.4.3 NKT A/S
- 6.4.4 ABB Ltd
- 6.4.5 Siemens Energy AG
- 6.4.6 Southwire Company LLC
- 6.4.7 LS Cable & System Ltd
- 6.4.8 Sumitomo Electric Industries Ltd
- 6.4.9 General Cable Corp (Prysmian)
- 6.4.10 KEI Industries Ltd
- 6.4.11 Furukawa Electric Co Ltd
- 6.4.12 Taihan Cable & Solution
- 6.4.13 Tratos Ltd
- 6.4.14 Finolex Cables Ltd
- 6.4.15 Cable Corporation of India Ltd
- 6.4.16 Jiangsu Zhongtian Technology Co
- 6.4.17 Dubai Cable Co (DUCAB)
- 6.4.18 Gupta Power Infrastructure Ltd
- 6.4.19 Elsewedy Electric
- 6.4.20 Riyadh Cables Group
7 Market Opportunities & Future Outlook
- 7.1 White-space & unmet-need assessment

