
PUBLISHER: Mordor Intelligence | PRODUCT CODE: 2066512

PUBLISHER: Mordor Intelligence | PRODUCT CODE: 2066512
United States Organic Fertilizers - Market Share Analysis, Industry Trends & Statistics, Growth Forecasts (2026 - 2031)
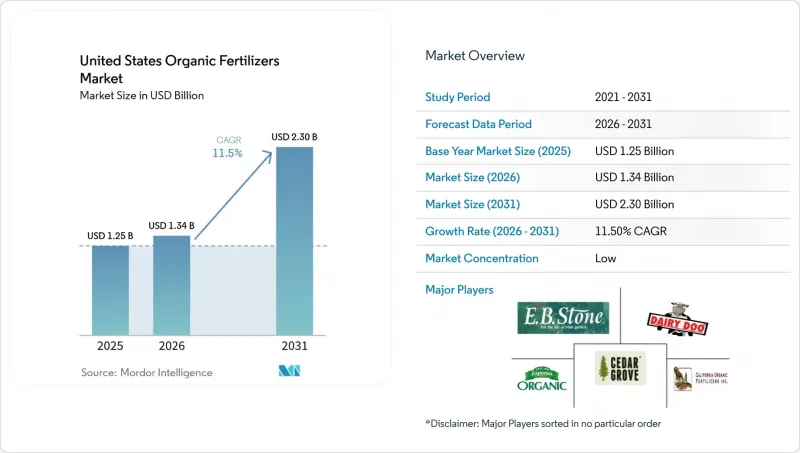
According to Mordor Intelligence, the united states organic fertilizers market size is anticipated to increase from USD 1.25 billion in 2025 to USD 1.34 billion in 2026 and reach USD 2.30 billion by 2031, growing at a CAGR of 11.5% over 2026-2031.
This report is Segmented by Form (Manure, Meal-Based Fertilizers, and More) and by Crop Type (Cash Crops, Horticultural Crops, and More). The Market Forecasts are Provided in Terms of Value (USD) and Volume (Metric Tons).
United States Organic Fertilizers Market Trends and Insights
Rapid Growth of Certified Organic Farmland
United States Department of Agriculture data confirm that grant-funded technical support is accelerating acreage conversion despite weather-related certification backlogs. The USD 300 million Organic Transition Initiative covers up to 75% of testing and audit fees, making Organic Materials Review Institute-listed inputs financially accessible for midsize farms. Newly issued Harmonized Tariff Schedule codes for organic imports tighten traceability rules, which indirectly benefit domestic growers by reducing fraudulent competition. As each acre enters compliance, baseline demand for the United States organic fertilizers market rises because synthetic nitrogen is prohibited, locking in multi-year purchasing commitments.
Rising Consumer Demand for Chemical-Free Produce
The Organic Trade Association reported a 5.2% year-over-year sales increase to USD 71.6 billion in 2024, even as inflation constrained household budgets Retail contracts now require year-round organic supply, forcing growers to secure reliable nutrient sources that meet National Organic Program standards. Because price premiums remain 20%-50% over conventional equivalents, farmers can absorb the higher per-acre cost of organic products without eroding margins. This spending resilience ties fertilizer demand more tightly to consumer sentiment than to commodity cycles, insulating the United States organic fertilizers market from global synthetic price swings.
Limited Nutrient Density Versus Synthetic Alternatives
Typical organic formulations offer NPK ratios under 5-5-5, forcing 10-15 times greater application volumes to match synthetic nitrogen delivery. The logistics burden inflates hauling costs and strains labor during tight planting windows. Higher-density options such as blood meal improve efficiency but retail for three to five times the cost of urea, restricting adoption to premium operations. Until cost-effective concentration technologies scale, density gaps will moderate growth across the United States organic fertilizers market.
Other drivers and restraints analyzed in the detailed report include:
- Federal Cost-Share Incentives for Transitioning Farms
- Expansion of Organic Livestock Operations
- Slow-Release Profile Unsuitable for Certain Cash Crops
For complete list of drivers and restraints, kindly check the Table Of Contents.
Segment Analysis
Manure-based products secured the largest United States organic fertilizers market share of 46.9% in 2025 and are projected to maintain their leadership position, registering the fastest CAGR of 12.5% during 2026-2031. Although manure has a low nutrient density, its contribution of organic matter aligns with regenerative agriculture standards, making it a key input for soil health programs. To address transportation costs, producers are pelletizing manure, which slightly increases its density while maintaining Organic Materials Review Institute (OMRI) approval.
Meal-based fertilizers, oilcakes, and blended compost products occupy premium positions in the retail market. However, rising feed costs are limiting raw material availability and pushing price ceilings higher. Oilcake products offer balanced macronutrient ratios and appeal to vegetable growers, but their supply depends on byproduct volumes from crush plants, which are influenced by fluctuations in biofuel demand. Specialty compost blends, incorporating biochar and microbial inoculants, are designed to meet carbon-credit protocols, further diversifying the organic fertilizer market in the United States. As regulatory scrutiny on contaminants increases, the traceability benefits of vertically integrated supply chains enhance the competitive advantage of established market players.
List of Companies Covered in this Report:
- Cedar Grove Composting Inc.
- EB Stone & Son Inc.
- The Espoma Company
- California Organic Fertilizers Inc.
- Morgan Composting Inc.
- Atlas Organics (Generate Upcycle)
- Sustane Natural Fertilizer Inc.
- Cascade Agronomics LLC
- The Richlawn Company LLC
- Walts Organic Fertilizers Co.
- Darling Ingredients (Nature Safe)
- Midwestern BioAg
- BioFlora
- Perfect Blend LLC
- Synagro Technologies, Inc.
Additional Benefits:
- The market estimate (ME) sheet in Excel format
- 3 months of analyst support
TABLE OF CONTENTS
1 INTRODUCTION
- 1.1 Study Assumptions and Market Definition
- 1.2 Scope of the Study
- 1.3 Research Methodology
2 EXECUTIVE SUMMARY AND KEY FINDINGS
3 REPORT OFFERS
4 KEY INDUSTRY TRENDS
- 4.1 Area Under Organic Cultivation
- 4.2 Per Capita Spending on Organic Products
- 4.3 Regulatory Framework
- 4.4 Value Chain and Distribution Channel Analysis
- 4.5 Market Drivers
- 4.5.1 Rapid growth of certified organic farmland
- 4.5.2 Rising consumer demand for chemical-free produce
- 4.5.3 Federal cost-share incentives for transitioning farms
- 4.5.4 Expansion of organic livestock operations
- 4.5.5 Carbon-credit monetization for compost use
- 4.5.6 Emerging state soil-health mandates favoring organic amendments
- 4.6 Market Restraints
- 4.6.1 Limited nutrient density versus synthetic alternatives
- 4.6.2 Volatility in feedstock supply prices
- 4.6.3 Slow-release profile unsuitable for certain cash crops
- 4.6.4 Stringent state-level pathogen regulations increasing compliance costs
5 MARKET SIZE AND GROWTH FORECASTS (VALUE AND VOLUME)
- 5.1 By Form
- 5.1.1 Manure
- 5.1.2 Meal-Based Fertilizers
- 5.1.3 Oilcakes
- 5.1.4 Other Organic Fertilizer
- 5.2 By Crop Type
- 5.2.1 Cash Crops
- 5.2.2 Horticultural Crops
- 5.2.3 Row Crops
6 COMPETITIVE LANDSCAPE
- 6.1 Key Strategic Moves
- 6.2 Market Share Analysis
- 6.3 Company Profiles (Includes Global Level Overview, Market Level Overview, Core Segments, Financials as Available, Strategic Information, Market Rank/Share for Key Companies, Products and Services, and Recent Developments)
- 6.3.1 Cedar Grove Composting Inc.
- 6.3.2 EB Stone & Son Inc.
- 6.3.3 The Espoma Company
- 6.3.4 California Organic Fertilizers Inc.
- 6.3.5 Morgan Composting Inc.
- 6.3.6 Atlas Organics (Generate Upcycle)
- 6.3.7 Sustane Natural Fertilizer Inc.
- 6.3.8 Cascade Agronomics LLC
- 6.3.9 The Richlawn Company LLC
- 6.3.10 Walts Organic Fertilizers Co.
- 6.3.11 Darling Ingredients (Nature Safe)
- 6.3.12 Midwestern BioAg
- 6.3.13 BioFlora
- 6.3.14 Perfect Blend LLC
- 6.3.15 Synagro Technologies, Inc.
7 KEY STRATEGIC QUESTIONS FOR AGRICULTURAL BIOLOGICAL CEOS

