
PUBLISHER: Mordor Intelligence | PRODUCT CODE: 2066539

PUBLISHER: Mordor Intelligence | PRODUCT CODE: 2066539
Non-Volatile Memory - Market Share Analysis, Industry Trends & Statistics, Growth Forecasts (2026 - 2031)
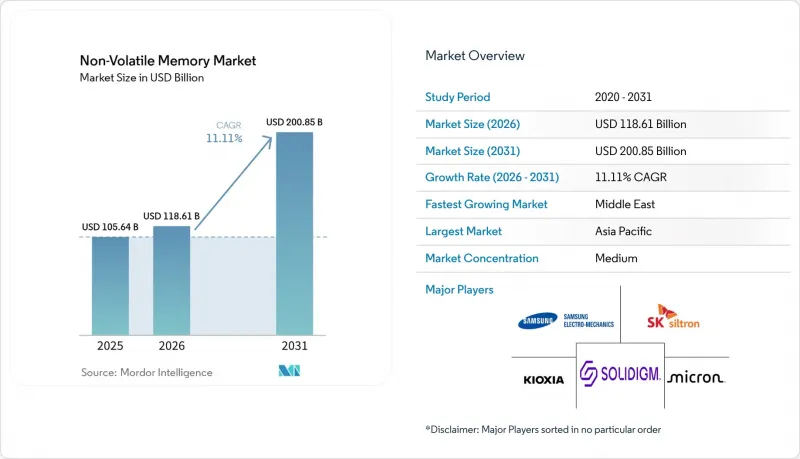
According to Mordor Intelligence, the non-volatile memory market size is projected to expand from USD 105.64 billion in 2025 and USD 118.61 billion in 2026 to USD 200.85 billion by 2031, registering a CAGR of 11.11% between 2026 and 2031.
This report is Segmented by Memory Type (Traditional Non-Volatile Memory, and Next-Generation and More), End-User Industry (Consumer Electronics, IT and Telecom, and More), Interface (PCIe/NVMe, SATA, SPI/I2C, and More), Density (<=256 Mb, 512 Mb-1 Gb, 2 Gb-4 Gb, and >=8 Gb), Application (Enterprise Storage, Industrial Automation, and More), and Geography. The Market Forecasts are Provided in Terms of Value (USD).
Global Non-Volatile Memory Market Trends and Insights
Exploding Data-Center Build-Outs Elevate Demand for Enterprise-Class NVM
Hyperscalers plan to deploy 100 GW of new data-center capacity between 2026 and 2030, and each rack integrates petabyte-scale all-flash arrays to serve inference workloads. PCIe Gen 6 solid-state drives, such as Micron's 9650, deliver 28 GB/s of sequential read throughput, closing the gap between compute and storage throughput. NVIDIA's Inference Compute Memory Storage Platform offloads key-value stores from high-bandwidth memory to enterprise SSDs, trimming accelerator costs by 30% while holding retrieval latency below one millisecond. This shift favors triple-level cell NAND that withstands 3 drive writes per day, elevating the non-volatile memory market as a strategic buffer between DRAM and object storage. As server refresh cycles accelerate from five to three years, suppliers that master firmware-level endurance optimization secure long-term contracts with hyperscalers.
Proliferation of Automotive ADAS and In-Vehicle Infotainment
Software-defined vehicles allocate 2-4 TB of storage for high-definition maps, over-the-air updates, and sensor-fusion logs. Infineon's SEMPER NOR Flash earned ASIL-D safety certification under ISO 26262, enabling fail-operational boot architectures in Level 3 autonomy. Universal Flash Storage 4.0 replaces legacy embedded MultiMediaCard to sustain 4K video streaming at lower power. Automotive-grade NAND must survive -40 °C to 125 °C and 3 000 program-erase cycles, commanding a 40% premium over consumer-grade modules. The transition from 12-V to 48-V electrical systems introduces voltage transients, prompting original equipment manufacturers to specify on-die error-correcting code and power-loss protection, boosting the bill of materials yet ensuring data integrity during regenerative braking.
Low Write-Endurance in Certain NVM Architectures
Quad-level cell NAND endures only 500 program-erase cycles and penta-level cell just 200, compared with 3 000 for triple-level cell. Database logging and AI checkpointing reach write amplification factors above 5, exhausting quad-level cell drives within 18 months. Machine-learning controllers extend life by 40% but add 28% over-provisioning, eroding cost advantages. Hyperscalers now reserve triple-level cells for hot data and relegate quad-level cells to cold storage, fragmenting procurement plans. The endurance gap opens white space for MRAM and ReRAM in industrial loggers and automotive black boxes, where replacement costs exceed initial module pricing.
Other drivers and restraints analyzed in the detailed report include:
- Edge AI Workloads Requiring Persistent, Low-Latency Storage
- Mainstream Adoption of UFS 4.0 Interface in Smartphones
- Thermal Runaway Risks in High-Density 3D NAND Stacks
For complete list of drivers and restraints, kindly check the Table Of Contents.
Segment Analysis
Flash memory accounted for 63.78% of the non-volatile memory market share in 2025. Steady cost declines sustained its dominance, yet MRAM is projected to grow at an 11.97% CAGR through 2031. The non-volatile memory market size tied to flash continues to expand, although write-heavy edge workloads expose endurance bottlenecks. MRAM shipments of 64 Mb, 128 Mb, and 256 Mb entered industrial controllers, railway signaling, and aviation black boxes, replacing NOR Flash where firmware updates exceed NAND's block-erase limitations.
Second-generation spin-orbit torque technology raises MRAM densities toward 1 Gb, and integration on 28 nm embedded logic yields deterministic 10 ns writes. Ferroelectric RAM services RFID tags that need 10^14 cycles but only kilobyte capacities. ReRAM and 3D XPoint aim for the storage-class memory tier, yet Intel's Optane exit created a commercialization pause that startups like Weebit Nano now aim to overcome through foundry alliances. These dynamics illustrate a pivot where system architects pair high-capacity NAND with byte-addressable MRAM to balance endurance and cost, a design that reshapes the non-volatile memory market over the forecast horizon.
Consumer electronics accounted for 44.81% of demand in 2025, driven by more than 2 billion smartphones, tablets, and laptops. Automotive electronics, however, is anticipated to post an 11.56% CAGR through 2031 as electric vehicle volumes rise and advanced driver-assistance systems require ASIL-D-certified storage. The non-volatile memory market size attributable to vehicles multiplies as each software-defined platform embeds 10-20 electronic control units with 256 MB to 4 GB flash.
High-definition maps, over-the-air updates, and sensor logs are cached locally, elevating per-vehicle non-volatile memory content eightfold relative to internal-combustion models. Telecommunications infrastructure accounts for 28% of enterprise SSD shipments, while healthcare archiving mandates AES-256-encrypted NAND with 10-year retention. Industrial automation specifies shock-resistant NAND rated to -40 °C, and retail terminals adopt UFS 3.1 to cut boot times. Diversified end users reduce cyclicality, insulating suppliers when smartphone refresh cycles extend beyond three years.
Geography Analysis
Asia-Pacific accounted for 46.11% of non-volatile memory revenue in 2025, led by Samsung, SK hynix, Kioxia, and Taiwanese foundries, which supply 75% of global NAND output. Regional growth is projected at an 11.84% CAGR as South Korea's 21.6 trillion won (USD 15.7 billion) tax credits finance the Yongin cluster, and Japan's Ministry of Economy, Trade and Industry grants JPY 500 billion (USD 3.4 billion) to Micron's Hiroshima fab. China accelerates domestic NAND at Yangtze Memory, but U.S. export controls on extreme-ultraviolet scanners stall progress beyond 128-layer nodes.
North America held 24% share in 2025, buoyed by Amazon, Microsoft, and Google, whose collective 40 EB of enterprise SSD deployments anchor long-term procurement. The CHIPS and Science Act unlocks USD 52.7 billion in subsidies, with USD 6.44 billion for Micron's New York and Idaho expansions, USD 4.745 billion for Samsung's Texas line, and USD 950 million for SK hynix packaging in Indiana. Europe captured 16% demand as Germany's automotive tier-ones source ASIL-D NAND from Infineon and STMicroelectronics.
The Middle East posts the fastest regional CAGR of 12.25%, driven by USD 33.79 billion in sovereign-wealth spending on data-center infrastructure for smart-city and artificial intelligence services. South America and Africa together account for 8% of the market and rely on edge caching to offset limited backbone bandwidth, using UFS packages in base-station servers. Government subsidies reduce geographic concentration, yet the non-volatile memory market still hinges on three Northeast Asian economies, leaving supply vulnerable to seismic, political, and export-control events.
- ROHM Co. Ltd
- STMicroelectronics NV
- Fujitsu Ltd
- Solidigm Inc.
- Honeywell International Inc.
- Micron Technology Inc.
- Samsung Electronics Co. Ltd
- Crossbar Inc.
- Infineon Technologies AG
- Avalanche Technology Inc.
- Western Digital Corp.
- SK Hynix Inc.
- Kioxia Holdings Corp.
- NXP Semiconductors NV
- Sony Semiconductor Solutions Corp.
- Seagate Technology Holdings PLC
- Renesas Electronics Corp.
- Intel Corporation
- GigaDevice Semiconductor Inc.
- Winbond Electronics Corp.
Additional Benefits:
- The market estimate (ME) sheet in Excel format
- 3 months of analyst support
TABLE OF CONTENTS
1 INTRODUCTION
- 1.1 Study Assumptions and Market Definition
- 1.2 Scope of the Study
2 RESEARCH METHODOLOGY
3 EXECUTIVE SUMMARY
4 MARKET LANDSCAPE
- 4.1 Market Overview
- 4.2 Market Drivers
- 4.2.1 Exploding Data-Center Build-Outs Elevate Demand for Enterprise-Class NVM
- 4.2.2 Proliferation of Automotive ADAS and In-Vehicle Infotainment
- 4.2.3 Edge AI Workloads Requiring Persistent, Low-Latency Storage
- 4.2.4 Mainstream Adoption of UFS 4.0 Interface in Smartphones
- 4.2.5 Commercialization of 3D-XPoint-Based Persistent Memory Modules
- 4.2.6 Government Incentives for Domestic Semiconductor Manufacturing
- 4.3 Market Restraints
- 4.3.1 Low Write-Endurance in Certain NVM Architectures
- 4.3.2 Thermal Runaway Risks in High-Density 3D NAND Stacks
- 4.3.3 Geopolitical Export Controls on Advanced Memory Nodes
- 4.3.4 Supply-Demand Cyclicality Causing Price Volatility
- 4.4 Impact of Macroeconomic Factors on the Market
- 4.5 Regulatory Landscape
- 4.6 Industrial Analysis
- 4.7 Porter's Five Forces Analysis
- 4.7.1 Threat of New Entrants
- 4.7.2 Bargaining Power of Buyers
- 4.7.3 Bargaining Power of Suppliers
- 4.7.4 Threat of Substitute Products
- 4.7.5 Intensity of Competitive Rivalry
5 MARKET SIZE AND GROWTH FORECASTS (VALUE)
- 5.1 By Memory Type
- 5.1.1 Traditional Non-Volatile Memory
- 5.1.1.1 Flash Memory
- 5.1.1.2 EEPROM
- 5.1.1.3 SRAM
- 5.1.1.4 EPROM
- 5.1.1.5 Rest of Traditional Non-Volatile Memory
- 5.1.2 Next-Generation Non-Volatile Memory
- 5.1.2.1 MRAM
- 5.1.2.2 FRAM
- 5.1.2.3 ReRAM
- 5.1.2.4 3D XPoint
- 5.1.2.5 Nano RAM
- 5.1.2.6 Rest of Next-Generation Non-Volatile Memory
- 5.1.1 Traditional Non-Volatile Memory
- 5.2 By End-User Industry
- 5.2.1 Consumer Electronics
- 5.2.2 Retail
- 5.2.3 IT and Telecom
- 5.2.4 Healthcare
- 5.2.5 Other End-User Industries
- 5.3 By Interface
- 5.3.1 PCIe/NVMe
- 5.3.2 SATA
- 5.3.3 USB
- 5.3.4 SPI/I2C
- 5.3.5 Other Interfaces
- 5.4 By Density
- 5.4.1 <=256 Mb
- 5.4.2 512 Mb-1 Gb
- 5.4.3 2 Gb-4 Gb
- 5.4.4 >=8 Gb
- 5.5 By Application
- 5.5.1 Enterprise Storage
- 5.5.2 Connected and Wearable Devices
- 5.5.3 Industrial Automation
- 5.5.4 Automotive Electronics
- 5.5.5 Rest of Applications
- 5.6 By Geography
- 5.6.1 North America
- 5.6.1.1 United States
- 5.6.1.2 Canada
- 5.6.1.3 Rest of North America
- 5.6.2 South America
- 5.6.2.1 Brazil
- 5.6.2.2 Argentina
- 5.6.2.3 Rest of South America
- 5.6.3 Europe
- 5.6.3.1 United Kingdom
- 5.6.3.2 Germany
- 5.6.3.3 France
- 5.6.3.4 Russia
- 5.6.3.5 Rest of Europe
- 5.6.4 Asia-Pacific
- 5.6.4.1 China
- 5.6.4.2 Japan
- 5.6.4.3 South Korea
- 5.6.4.4 India
- 5.6.4.5 Rest of Asia-Pacific
- 5.6.5 Middle East
- 5.6.5.1 Saudi Arabia
- 5.6.5.2 United Arab Emirates
- 5.6.5.3 Turkey
- 5.6.5.4 Rest of Middle East
- 5.6.6 Africa
- 5.6.6.1 South Africa
- 5.6.6.2 Nigeria
- 5.6.6.3 Rest of Africa
- 5.6.1 North America
6 COMPETITIVE LANDSCAPE
- 6.1 Market Concentration
- 6.2 Strategic Moves
- 6.3 Market Share Analysis
- 6.4 Company Profiles (includes Global Level Overview, Market Level Overview, Core Segments, Financials as available, Strategic Information, Market Rank/Share, Products and Services, Recent Developments)
- 6.4.1 ROHM Co. Ltd
- 6.4.2 STMicroelectronics NV
- 6.4.3 Fujitsu Ltd
- 6.4.4 Solidigm Inc.
- 6.4.5 Honeywell International Inc.
- 6.4.6 Micron Technology Inc.
- 6.4.7 Samsung Electronics Co. Ltd
- 6.4.8 Crossbar Inc.
- 6.4.9 Infineon Technologies AG
- 6.4.10 Avalanche Technology Inc.
- 6.4.11 Western Digital Corp.
- 6.4.12 SK Hynix Inc.
- 6.4.13 Kioxia Holdings Corp.
- 6.4.14 NXP Semiconductors NV
- 6.4.15 Sony Semiconductor Solutions Corp.
- 6.4.16 Seagate Technology Holdings PLC
- 6.4.17 Renesas Electronics Corp.
- 6.4.18 Intel Corporation
- 6.4.19 GigaDevice Semiconductor Inc.
- 6.4.20 Winbond Electronics Corp.
7 MARKET OPPORTUNITIES AND FUTURE OUTLOOK
- 7.1 White-Space and Unmet-Need Assessment

