
PUBLISHER: Mordor Intelligence | PRODUCT CODE: 2066606

PUBLISHER: Mordor Intelligence | PRODUCT CODE: 2066606
Medium Voltage Cable - Market Share Analysis, Industry Trends & Statistics, Growth Forecasts (2026 - 2031)
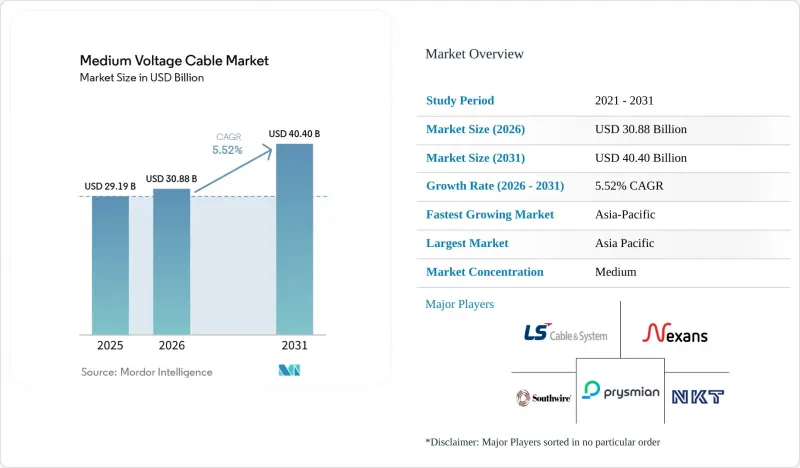
According to Mordor Intelligence, the medium voltage cable market size is projected to expand from USD 29.19 billion in 2025 and USD 30.88 billion in 2026 to USD 40.40 billion by 2031, registering a CAGR of 5.52% between 2026 to 2031.
This report is Segmented by Location of Deployment (Underground, Submarine, and Overhead), Type (AC and DC), End-User (Utility, Commercial, Industrial, and Residential), and Geography (North America, Europe, Asia-Pacific, South America, and Middle East and Africa). The Market Sizes and Forecasts are Provided in Terms of Value (USD).
Global Medium Voltage Cable Market Trends and Insights
Renewable-Linked Grid-Upgrade Mandates Drive Feeder Replacement Cycles
Germany's 2025 directive compels distribution operators to modernize 18,000 circuit-kilometers of 20 kV lines by 2029, tripling the historic replacement rate. China earmarked CNY 320 billion (USD 44 billion) for county-level 10-35 kV upgrades over five years, with early work concentrated in Inner Mongolia and Qinghai. India now ties renewable-certificate issuance to proof of spare grid capacity, prompting state utilities to pre-lay feeders in solar and wind zones. Because penalties range from subsidy claw-backs to direct fines, cable demand remains inelastic even when aluminium prices spike. Medium-voltage cable market participants with turnkey installation services are best placed to capture this captive volume, as distribution companies favor single-supplier contracts to shorten approval cycles.
Utility-Scale Battery Storage Amplifies Cable Demand
The United States added 9.4 GW of standalone batteries in 2024, each park using 34.5 kV loops between inverters and substations. Frequent cycling accelerates insulation aging, so vendors have begun to specify thicker XLPE and upgraded screening tapes that extend design life past 30 years. Three 500 MW projects in New South Wales combined require over 180 kilometers of 33 kV feeders, illustrating the material intensity of storage assets. Retrofit co-location at retired coal plants also multiplies orders because corrosion often necessitates complete cable replacement, not partial re-termination. This surge positions the medium-voltage cable market as a direct proxy for storage deployment momentum over the next two years.
Volatile aluminium & XLPE input prices
London Metal Exchange aluminium futures peaked at USD 2,680 per tonne in February 2025 before sliding to USD 2,320 by mid-year, while Brent-linked XLPE resin rose 14% then eased. Utilities still tender cables 12-18 months ahead, locking suppliers into fixed prices even when inputs rise, as Prysmian's Q1 2025 call showed with a 220-basis-point EBITDA drop. Smaller Asian manufacturers, lacking hedging tools, have already declared three bankruptcies since late 2024. If volatility persists, the medium-voltage cable market could see more consolidation as cash-light players exit.
Other drivers and restraints analyzed in the detailed report include:
- Industrial Electrification Opens Niche Demand
- Rapid Inter-Data-Center Power Looping Eases Utility Bottlenecks
- Utility CAPEX deferrals in sub-Saharan Africa
For complete list of drivers and restraints, kindly check the Table Of Contents.
Segment Analysis
Underground installations controlled 57.9% of 2025 revenue, reflecting dense-city mandates and wildfire-mitigation rules. Overhead spans remain cheaper, USD 180,000 per circuit-kilometer versus USD 620,000 for buried lines, but liability and visual objections limit new aerial builds in many developed regions. Submarine projects, though smaller in absolute dollars, are forecast at a 7.2% CAGR to 2031, powered by offshore wind arrays that now site turbines farther than 60 kilometers from shore and by hydrogen pilot plants needing 20 MW plus feeds. A 66 kV system delivered by NKT to Hollandse Kust West in 2025 showed that inter-array runs can exceed 15 kilometers without intermediate platforms. Rising water depths also spur accessory innovation, adding 12-18% to project cost but boosting reliability in harsh seabed conditions.
The medium-voltage cable market size for submarine projects is anticipated to reach USD 7.1 billion by 2031, up from roughly USD 4.7 billion in 2026, underscoring how offshore wind and hydrogen corridors are recasting deployment patterns. Overhead solutions will persist in low-density zones, yet their share will slip as more regulators demand undergrounding for resiliency. Underground growth likewise benefits from smart-city programs that hide utility assets below grade to free surface real estate. Suppliers able to package cable, joints, and real-time monitoring stand to win margin as customers shift toward total-cost-of-ownership procurement.
Geography Analysis
Asia-Pacific generated 48.3% of worldwide revenue in 2025, and the region is projected to register a 6.5% CAGR to 2031 thanks to Chinese county-level upgrades, Indian rail electrification, and Southeast Asian renewables. China allocated CNY 320 billion through 2029 to modernize 10-35 kV feeders, mostly in provinces with high wind and solar penetration. India is electrifying 25,000 route-kilometers of rail, each kilometer demanding up to 10 circuit-kilometers of 25 kV traction cable. ASEAN nations collectively plan 12,000 circuit-kilometers of feeder cable for solar and wind farms between 2025 and 2028.
North America held a roughly 22% share in 2025, underpinned by the U.S. Infrastructure Investment and Jobs Act and Canadian provincial programs. The U.S. Department of Energy's Grid Resilience and Innovation Partnerships awarded USD 3.5 billion in 2024 to underground medium-voltage lines in wildfire corridors. Hyperscaler demand concentrates in Virginia, Iowa, and Dallas metro zones, where private loops often bypass congested substations. Canada's push to phase out coal by 2030 compels utilities in Saskatchewan and Alberta to add distribution capacity for wind-sited battery projects.
Europe represented about 20% of 2025 sales. REPowerEU targets drive offshore wind and hydrogen pilots, yet permit delays and labor shortages slow execution. Urban retrofit needs are acute; many city centers still rely on paper-insulated lead-covered cable that must be replaced without full excavation. Suppliers offering compact, high-voltage-rated products able to snake through old ducts meet this requirement. South America and the Middle East-Africa together contributed near 10% in 2025; Brazil's auction pipeline and Saudi Arabia's NEOM program stand out, though exchange-rate swings and financing costs temper broader uptake. Overall, Asia-Pacific remains the growth engine, while mature Western markets pivot toward resiliency and decarbonization retrofits.
- Prysmian Group
- Nexans SA
- NKT A/S
- LS Cable & System
- Southwire Co.
- Sumitomo Electric Ind.
- Furukawa Electric
- KEI Industries
- Elsewedy Electric
- Riyadh Cables Group
- Cablel Hellenic Cables
- Brugg Cables
- The Okonite Company
- General Cable Corp.
- Marmon Utility (Kerite & Hendrix)
- Encore Wire Corp.
- Leoni AG
- TPC Wire & Cable
- Siemens Energy (MV systems)
- ABB Ltd. (Power Grids)
Additional Benefits:
- The market estimate (ME) sheet in Excel format
- 3 months of analyst support
TABLE OF CONTENTS
1 Introduction
- 1.1 Study Assumptions & Market Definition
- 1.2 Scope of the Study
2 Research Methodology
3 Executive Summary
4 Market Landscape
- 4.1 Market Overview
- 4.2 Market Drivers
- 4.2.1 Renewable-linked grid-upgrade mandates (2025-2030)
- 4.2.2 Surge in utility-scale battery energy storage roll-outs
- 4.2.3 Electrification of high-temperature industrial heat
- 4.2.4 Rapid inter-data-center power looping (hyperscalers)
- 4.2.5 Mainstream urban electrified mass-transit extensions
- 4.2.6 Offshore hydrogen demo clusters (>= 20 MW)
- 4.3 Market Restraints
- 4.3.1 Volatile aluminium & XLPE input prices
- 4.3.2 Utility CAPEX deferrals in sub-Saharan Africa
- 4.3.3 Installation permit bottlenecks in dense metros
- 4.3.4 Stricter PFAS-free insulation compliance costs
- 4.4 Supply-Chain Analysis
- 4.5 Regulatory Landscape
- 4.6 Technological Outlook
- 4.7 Porter's Five Forces
- 4.7.1 Bargaining Power of Suppliers
- 4.7.2 Bargaining Power of Buyers
- 4.7.3 Threat of New Entrants
- 4.7.4 Threat of Substitutes
- 4.7.5 Intensity of Rivalry
5 Market Size & Growth Forecasts
- 5.1 By Location of Deployment
- 5.1.1 Underground
- 5.1.2 Submarine
- 5.1.3 Overhead
- 5.2 By Type
- 5.2.1 AC
- 5.2.2 DC
- 5.3 By End-user
- 5.3.1 Utility
- 5.3.2 Commercial
- 5.3.3 Industrial
- 5.3.4 Residential
- 5.4 By Geography
- 5.4.1 North America
- 5.4.1.1 United States
- 5.4.1.2 Canada
- 5.4.1.3 Mexico
- 5.4.2 Europe
- 5.4.2.1 Germany
- 5.4.2.2 United Kingdom
- 5.4.2.3 France
- 5.4.2.4 Italy
- 5.4.2.5 Russia
- 5.4.2.6 Rest of Europe
- 5.4.3 Asia-Pacific
- 5.4.3.1 China
- 5.4.3.2 India
- 5.4.3.3 Japan
- 5.4.3.4 South Korea
- 5.4.3.5 ASEAN Countries
- 5.4.3.6 Rest of Asia-Pacific
- 5.4.4 South America
- 5.4.4.1 Brazil
- 5.4.4.2 Argentina
- 5.4.4.3 Rest of South America
- 5.4.5 Middle East and Africa
- 5.4.5.1 Saudi Arabia
- 5.4.5.2 United Arab Emirates
- 5.4.5.3 South Africa
- 5.4.5.4 Egypt
- 5.4.5.5 Rest of Middle East and Africa
- 5.4.1 North America
6 Competitive Landscape
- 6.1 Market Concentration
- 6.2 Strategic Moves (M&A, Partnerships, PPAs)
- 6.3 Market Share Analysis (Market Rank/Share for key companies)
- 6.4 Company Profiles (includes Global level Overview, Market level overview, Core Segments, Financials as available, Strategic Information, Products & Services, and Recent Developments)
- 6.4.1 Prysmian Group
- 6.4.2 Nexans SA
- 6.4.3 NKT A/S
- 6.4.4 LS Cable & System
- 6.4.5 Southwire Co.
- 6.4.6 Sumitomo Electric Ind.
- 6.4.7 Furukawa Electric
- 6.4.8 KEI Industries
- 6.4.9 Elsewedy Electric
- 6.4.10 Riyadh Cables Group
- 6.4.11 Cablel Hellenic Cables
- 6.4.12 Brugg Cables
- 6.4.13 The Okonite Company
- 6.4.14 General Cable Corp.
- 6.4.15 Marmon Utility (Kerite & Hendrix)
- 6.4.16 Encore Wire Corp.
- 6.4.17 Leoni AG
- 6.4.18 TPC Wire & Cable
- 6.4.19 Siemens Energy (MV systems)
- 6.4.20 ABB Ltd. (Power Grids)
7 Market Opportunities & Future Outlook
- 7.1 White-space & Unmet-Need Assessment

