
PUBLISHER: Mordor Intelligence | PRODUCT CODE: 2066620

PUBLISHER: Mordor Intelligence | PRODUCT CODE: 2066620
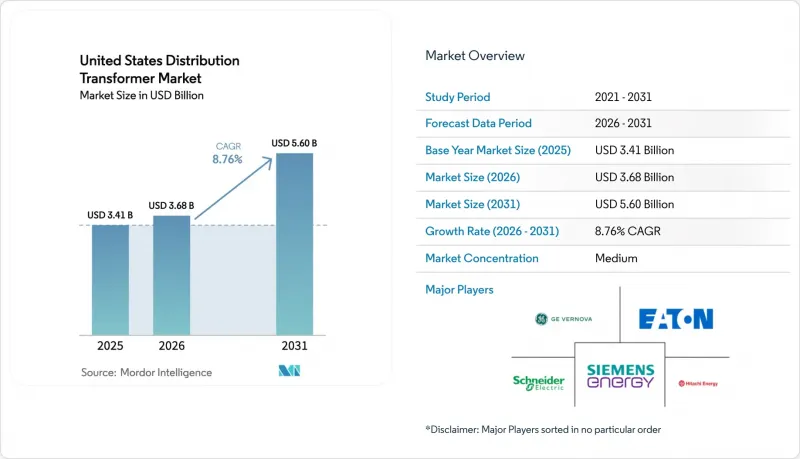
United States Distribution Transformer - Market Share Analysis, Industry Trends & Statistics, Growth Forecasts (2026 - 2031)
According to Mordor Intelligence, the united states distribution transformer market size is projected to expand from USD 3.41 billion in 2025 and USD 3.68 billion in 2026 to USD 5.60 billion by 2031, registering a CAGR of 8.76% between 2026 to 2031.
This report is Segmented by Power Rating (Large, Medium, and Small), Cooling Type (Air-Cooled and Oil-Cooled), Phase (Single-Phase and Three-Phase), and End-User (Power Utilities, Industrial, Commercial, and Residential). The Market Sizes and Forecasts are Provided in Terms of Value (USD).
United States Distribution Transformer Market Trends and Insights
Rising Electricity Demand & Electrification Wave
Electricity consumption in the United States recorded four consecutive years of growth through 2026, with the Energy Information Administration projecting a 2% annual rise driven by data-center capacity additions, semiconductor fabrication, and space-heating electrification. Utilities are therefore ordering distribution transformers earlier than their historical replacement cadence and are favoring higher-rated units to defer future upgrades. Data-center developers now routinely request feeders capable of handling 20-50 MW, translating into multiple 34.5 kV, 20-40 MVA transformers per site. Industrial electrification, particularly heat-pump retrofits and electric-arc furnaces, is spurring demand for three-phase transformers that can tolerate high harmonic content. As a result, manufacturers must increase buffer inventory of cores and windings to service short-cycle industrial orders without delaying utility backlog. Elevated base-load growth is also stimulating interest in transformer monitoring to push assets beyond the traditional 30-year design life, creating cross-selling opportunities for digital services.
Grid-Modernization Funding Under IIJA & DOE Programs
The Infrastructure Investment and Jobs Act committed USD 10.5 billion to the Grid Resilience and Innovation Partnerships initiative, while an additional USD 2.5 billion flowed to state energy offices through formula grants. These appropriations shorten procurement calendars by 12-18 months because funded projects must reach mechanical completion by 2027. Embedded sensing and communications are now baseline specifications on GRIP-financed transformers, giving a competitive edge to suppliers with proven Internet-of-Things platforms. The DOE Transformer Rebate Program, though modest at USD 20 million, established a scoring system that elevates lifecycle efficiency over the lowest bid, further differentiating vendors with amorphous-core production capacity. Utilities tapping federal funds face schedule-liquidated damages if milestones slip, which incentivizes the purchase of domestically sourced units that can ship in 12-14 months rather than waiting 18-24 months for imports. Early grant recipients in Texas and California have already issued multi-year framework agreements that lock in both volume and pricing, providing order visibility to manufacturers through 2028.
Distributed Generation Cannibalizing Peak-Load Growth
California exceeded 1.5 million rooftop solar systems by 2025, trimming midday peak demand 8-12% in areas served by Pacific Gas & Electric. Utilities in high-solar states now re-optimize feeders rather than adding new capacity, directly reducing transformer purchases. Hawaii Electric cut its 2025-2030 procurement plan by 18% compared with its 2020 baseline after distributed PV and batteries met incremental load. This restraint is most acute for single-phase pole-top units whose replacement is tied primarily to capacity rather than age. Consequently, OEMs are pivoting toward retrofit kits, monitoring modules, and clamp-on voltage regulators that extend life and improve visibility without requiring full unit swaps.
Other drivers and restraints analyzed in the detailed report include:
- Renewable & DER Integration Creating Bi-Directional Load Flows
- Domestic Sourcing Rules Spurring On-Shoring of Transformer Manufacturing
- Volatile Copper and GOES Prices Inflating Capex
For complete list of drivers and restraints, kindly check the Table Of Contents.
Segment Analysis
Medium transformers (10-100 MVA) commanded 41.8% of 2025 revenue and are forecast to grow at a 9.6% CAGR to 2031. This slice of the United States distribution transformer market size benefits from both substation modernization and industrial expansions requiring dedicated medium-voltage feeders. Large transformers above 100 MVA cater mainly to transmission projects, and their growth lags as utilities channel budgets toward distribution resilience instead of bulk-power corridors.
Utilities also favor trailer-mounted medium units that can be moved into wildfire or hurricane zones during emergencies, broadening the addressable United States distribution transformer market. Small transformers below 10 MVA remain the volume leader in units, but face margin compression as utilities standardize ratings to simplify inventory. The rising share of medium equipment, therefore, boosts dollar revenue faster than overall shipment counts.
Oil-filled equipment held 80.9% market share in 2025, thanks to lower cost and superior heat dissipation. Yet air-cooled dry-type units are projected to expand at a 9.9% CAGR on stricter fire codes in dense urban zones and growing data-center adoption. Dry-type designs remove the risk of oil leaks, which eases permitting and insurance requirements for indoor substations. For utilities chasing Infrastructure Investment and Jobs Act deadlines, factory-assembled dry units also shorten civil works schedules.
Nevertheless, higher losses at full load and a footprint roughly one-third larger than oil-filled equivalents keep dry transformers from displacing their oil-cooled counterparts in space-constrained vaults or high-duty solar-collector circuits. As a result, oil-filled solutions will retain the majority of the United States distribution transformer market share over the forecast horizon, even as dry units carve out lucrative niches.
List of Companies Covered in this Report:
- Hitachi Energy (ABB)
- Siemens Energy
- Eaton Corporation
- GE Vernova (Prolec GE & SPX)
- Schneider Electric
- Howard Industries
- ERMCO
- Central Moloney
- Virginia Transformer Corp.
- Hammond Power Solutions
- Mitsubishi Electric Power Products
- WEG Electric
- Delta Star
- Pioneer Power Solutions
- Pacific Crest Transformers
- MGM Transformer Company
- SGB-SMIT Group
- SPX Transformer Solutions
- Howard Power Solutions
Additional Benefits:
- The market estimate (ME) sheet in Excel format
- 3 months of analyst support
TABLE OF CONTENTS
1 Introduction
- 1.1 Study Assumptions & Market Definition
- 1.2 Scope of the Study
2 Research Methodology
3 Executive Summary
4 Market Landscape
- 4.1 Market Overview
- 4.2 Market Drivers
- 4.2.1 Rising electricity demand & electrification wave
- 4.2.2 Grid-modernization funding under IIJA & DOE programs
- 4.2.3 Renewable & DER integration creating bi-directional load flows
- 4.2.4 Domestic sourcing rules spurring on-shoring of transformer manufacturing
- 4.2.5 Data-center cluster build-outs requiring medium-voltage distribution upgrades
- 4.2.6 Federal & state EV-charging corridor mandates
- 4.3 Market Restraints
- 4.3.1 Distributed generation cannibalizing peak-load growth
- 4.3.2 Volatile copper & GOES prices inflating capex
- 4.3.3 Tight U.S. GOES supply chain extending transformer lead times
- 4.3.4 2027 DOE efficiency rules raising compliance costs
- 4.4 Supply-Chain Analysis
- 4.5 Regulatory Landscape
- 4.6 Technological Outlook
- 4.7 Porter's Five Forces
- 4.7.1 Threat of New Entrants
- 4.7.2 Bargaining Power of Buyers
- 4.7.3 Bargaining Power of Suppliers
- 4.7.4 Threat of Substitutes
- 4.7.5 Competitive Rivalry
- 4.8 PESTLE Analysis
5 Market Size & Growth Forecasts
- 5.1 By Power Rating
- 5.1.1 Large (Above 100 MVA)
- 5.1.2 Medium (10 to 100 MVA)
- 5.1.3 Small (Up to 10 MVA)
- 5.2 By Cooling Type
- 5.2.1 Air-cooled
- 5.2.2 Oil-cooled
- 5.3 By Phase
- 5.3.1 Single-Phase
- 5.3.2 Three-Phase
- 5.4 By End-User
- 5.4.1 Power Utilities (includes, Renewables, Non-renewables, and T&D)
- 5.4.2 Industrial
- 5.4.3 Commercial
- 5.4.4 Residential
6 Competitive Landscape
- 6.1 Market Concentration
- 6.2 Strategic Moves (M&A, Partnerships, PPAs)
- 6.3 Market Share Analysis (Market Rank/Share for key companies)
- 6.4 Company Profiles (includes Global level Overview, Market level overview, Core Segments, Financials as available, Strategic Information, Products & Services, and Recent Developments)
- 6.4.1 Hitachi Energy (ABB)
- 6.4.2 Siemens Energy
- 6.4.3 Eaton Corporation
- 6.4.4 GE Vernova (Prolec GE & SPX)
- 6.4.5 Schneider Electric
- 6.4.6 Howard Industries
- 6.4.7 ERMCO
- 6.4.8 Central Moloney
- 6.4.9 Virginia Transformer Corp.
- 6.4.10 Hammond Power Solutions
- 6.4.11 Mitsubishi Electric Power Products
- 6.4.12 WEG Electric
- 6.4.13 Delta Star
- 6.4.14 Pioneer Power Solutions
- 6.4.15 Pacific Crest Transformers
- 6.4.16 MGM Transformer Company
- 6.4.17 SGB-SMIT Group
- 6.4.18 SPX Transformer Solutions
- 6.4.19 Howard Power Solutions
7 Market Opportunities & Future Outlook
- 7.1 White-space & Unmet-Need Assessment

