
PUBLISHER: Mordor Intelligence | PRODUCT CODE: 2066650

PUBLISHER: Mordor Intelligence | PRODUCT CODE: 2066650
Smart Shelf - Market Share Analysis, Industry Trends & Statistics, Growth Forecasts (2026 - 2031)
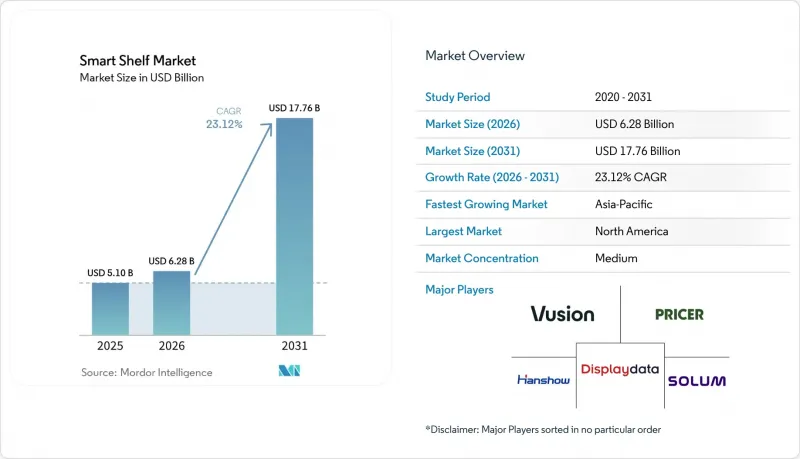
According to Mordor Intelligence, the smart shelf market size is expected to increase from USD 5.10 billion in 2025 to USD 6.28 billion in 2026 and reach USD 17.76 billion by 2031, growing at a CAGR of 23.12% over 2026-2031.
This report is Segmented by Component (Hardware (IoT Sensors, RFID Tags and Readers, and More), Software, and Services), Technology (RFID-Based, Weight Sensor-Based, Vision/Camera-Based, and More), Retail Format (Hypermarkets and Supermarkets, Convenience Stores, and More), Application (Inventory, Pricing, Content, Planogram, and More), and Geography. The Market Forecasts are Provided in Terms of Value (USD).
Global Smart Shelf Market Trends and Insights
Retail-Wide Push For Real-Time Pricing Accuracy
Chains are discarding batch overnight price changes because competitive show-rooming demands intraday updates that sync in-store and online prices. United Kingdom grocer Morrisons synchronized 10.8 million ESLs across its estate in 2025, eliminating checkout disputes and aligning with e-commerce prices. Walmart connected 2,300 U.S. stores by early 2026, cutting a full workday of label changes down to minutes while improving gross margin. India's Legal Metrology Act obliges supermarkets to display tamper-proof prices, accelerating ESL adoption among national chains. Dynamic markdowns tied to expiration windows now help reduce food waste, linking operational savings to corporate sustainability targets.
Rising Labor Costs Accelerating Retail Automation
Average hourly retail wages in the United States rose 4.8% year over year in 2025, putting pressure on grocers that still rely on manual label swaps and stock audits. ESLs redeploy associates toward assisted checkout and e-commerce picking, with Waitrose forecasting annual labor savings exceeding GBP 8 million (USD 10.1 million) once its United Kingdom rollout finishes in 2026. Co-op freed staff for online fulfillment after fitting 2,400 stores with ESLs, and sensor-based shelves now flag out-of-stocks automatically, replacing time-consuming aisle walks. Minimum-wage legislation across Europe and North America is shortening investment payback periods, making the smart shelf market attractive to regional retailers.
High Up-Front Capital For Store-Wide Retrofits
A single hypermarket installation can cost between USD 500,000 and USD 1.5 million, placing a strain on grocers operating on single-digit EBITDA. Convenience stores average 2,500 SKUs yet pay USD 15-20 per label after installation and networking, limiting deployments unless labor and shrinkage savings exceed 15%. Low-margin operators in emerging markets confront even steeper hurdles because transaction values are smaller, while financing products that amortize hardware into service fees remain scarce outside tier-one chains.
Other drivers and restraints analyzed in the detailed report include:
- Shrinkage Reduction Mandates By Large Grocers
- Computer-Vision Shelf Analytics Enabling Dynamic In-Store Media
- Integration Complexity With Legacy POS And ERP
For complete list of drivers and restraints, kindly check the Table Of Contents.
Segment Analysis
Services with 23.51% CAGR growth outpace hardware as retailers convert one-time purchases into recurring contracts that bundle analytics, maintenance, and software upgrades. The smart shelf market for services is scaling rapidly because managed programs offload battery changes, firmware updates, and network monitoring to vendors, freeing internal IT capacity. Hardware, while still the largest revenue contributor at 55.11% in 2025, is undergoing price deflation as Chinese ESL production expands and e-paper yields climb. Within hardware, IoT weight sensors and edge AI cameras are capturing share because they detect shelf gaps and misplacements within seconds, complementing passive RFID readers.
Software platforms powering those services now charge USD 5,000-15,000 annually per store for dashboards that visualize shrinkage heat maps, planogram compliance, and retail-media bidding. E Ink's collaboration with Himax on on-device AI has shifted image recognition from cloud to shelf, reducing bandwidth costs and latency. Meanwhile, ultra-high-frequency RFID Gen2v2 readers interrogate up to 1,000 tags per second, opening warehouse and distribution center cases for the smart shelf market.
RFID-based shelves hold 40.18% smart shelf market share because they work without line-of-sight and plug into global supply-chain standards. Kroger extended RFID from apparel into the fresh bakery to automate expiry, validating use cases beyond hardlines. Yet vision and camera systems are scaling at a 24.28% CAGR, driven by falling edge AI compute costs and improved planogram accuracy. Trax alone photographs more than 400,000 stores worldwide, proving image-based audits can match or exceed RFID for some merchandising tasks.
Electronic shelf labels overlap both technologies and now carry near-field communication chips that let shoppers tap for ingredient data, uniting physical shelves with digital content. Weight-sensor shelves fill safety-critical niches such as pharmacy narcotics tracking, where instant removal alerts deter diversion. New battery-free RFID prototypes from Energous and Georgia Tech promise to eliminate maintenance costs and unlock ultra-dense tagging that was previously uneconomic, reinforcing RFID relevance in the smart shelf market.
Geography Analysis
North America generated 34.16% of 2025 revenue as Walmart and Kroger scaled ESL and RFID programs. U.S. labor inflation and an established vendor ecosystem underpin mainstream adoption, while Canadian pilots accelerate following Walmart Canada's requirement that suppliers tag apparel and home goods. Mexico's leading grocers are testing ESLs to align omnichannel prices and curb checkout disputes, yet high capital costs are slowing broad mid-market adoption.
Europe follows as the second-largest region, led by the United Kingdom, where Morrisons, Co-op, and Waitrose each committed to nationwide ESL coverage. Germany's Kaufland, France's Carrefour, and Spain's pharmacy chains illustrate the breadth of the continent, and the EU AI Act is shaping transparent shopper analyticsshopper analytics deployments. Northern and Eastern Europe are rolling out at a steadier pace, with Norway experimenting with demand-based dynamic pricing.
Asia-Pacific is the fastest-growing region, projected at 24.55% CAGR. China's new retail pioneers, India's Legal Metrology compliance, and Japan's labor-scarce convenience chains all drive momentum, while South Korea's domestic ESL makers scale exports. Australia's pharmacies and Singapore's convenience pilots showcase incremental wins in mature sub-markets, whereas wider Southeast Asia adopts cautiously amid financing limitations. Middle East operators leverage government modernization funds, with Israel's Carrefour deploying smart carts and Saudi hypermarkets embracing ESLs under Vision 2030. South Africa leads African pilots, and South America mirrors inflation-driven North American logic, with Brazil and Argentina retail chains using daily commodity swings to justify ESL speed.
- VusionGroup S.A.
- Pricer AB
- Hanshow Technology Co., Ltd.
- Displaydata Limited
- SoluM Co., Ltd.
- Opticon Sensors Europe B.V.
- E Ink Holdings Inc.
- Keonn Technologies S.L.
- RAINUS Co., Ltd.
- Avery Dennison Corporation
- Zebra Technologies Corporation
- Honeywell International Inc.
- Impinj, Inc.
- Trax Technology Solutions Pte. Ltd.
- Focal Systems Inc.
- Digi International Inc.
- Checkpoint Systems, Inc.
- SATO Holdings Corporation
- Teraoka Seiko Co., Ltd.
- Altierre Corporation
Additional Benefits:
- The market estimate (ME) sheet in Excel format
- 3 months of analyst support
TABLE OF CONTENTS
1 INTRODUCTION
- 1.1 Study Assumptions and Market Definition
- 1.2 Scope of the Study
2 RESEARCH METHODOLOGY
3 EXECUTIVE SUMMARY
4 MARKET LANDSCAPE
- 4.1 Market Overview
- 4.2 Market Drivers
- 4.2.1 Retail-Wide Push for Real-Time Pricing Accuracy
- 4.2.2 Rising Labor Costs Accelerating Retail Automation
- 4.2.3 Shrinkage Reduction Mandates by Large Grocers
- 4.2.4 ESG Pressure to Eliminate Paper Shelf Labels
- 4.2.5 Computer-Vision Shelf Analytics Enabling Dynamic In-Store Media
- 4.2.6 Battery-Free RFID Tag Research and Development Unlocking Ultra-Low-Cost Deployments
- 4.3 Market Restraints
- 4.3.1 High Up-Front Capital for Store-Wide Retrofits
- 4.3.2 Integration Complexity with Legacy POS and ERP
- 4.3.3 Data-Privacy Compliance (GDPR, CCPA) Burden
- 4.3.4 Growing Counterfeit Smart-Shelf Components Supply Risk
- 4.4 Industry Value-Chain Analysis
- 4.5 Regulatory Landscape
- 4.6 Technological Outlook
- 4.7 Impact of Macroeconomic Factors on the Market
- 4.8 Porter's Five Forces Analysis
- 4.8.1 Threat of New Entrants
- 4.8.2 Bargaining Power of Suppliers
- 4.8.3 Bargaining Power of Buyers
- 4.8.4 Threat of Substitutes
- 4.8.5 Competitive Rivalry
5 MARKET SIZE AND GROWTH FORECASTS (VALUE)
- 5.1 By Component
- 5.1.1 Hardware
- 5.1.1.1 IoT Sensors
- 5.1.1.2 RFID Tags and Readers
- 5.1.1.3 Electronic Shelf Lables (ESL)
- 5.1.1.4 Cameras
- 5.1.2 Software
- 5.1.3 Services
- 5.1.1 Hardware
- 5.2 By Technology
- 5.2.1 RFID-Based Smart Shelves
- 5.2.2 Weight Sensor-Based Smart Shelves
- 5.2.3 Vision/Camera-Based Smart Shelves
- 5.2.4 Electronic Shelf Label (ESL) Systems
- 5.2.5 Other Technologies
- 5.3 By Retail Format
- 5.3.1 Hypermarkets and Supermarkets
- 5.3.2 Convenience Stores
- 5.3.3 Specialty Stores
- 5.3.4 Pharmacies
- 5.3.5 Warehouses and Distribution Centers
- 5.3.6 Other Retail Formats
- 5.4 By Application
- 5.4.1 Inventory Management
- 5.4.2 Pricing Management
- 5.4.3 Content Management
- 5.4.4 Planogram Management
- 5.4.5 Other Applications
- 5.5 By Geography
- 5.5.1 North America
- 5.5.1.1 United States
- 5.5.1.2 Canada
- 5.5.1.3 Mexico
- 5.5.2 Europe
- 5.5.2.1 United Kingdom
- 5.5.2.2 Germany
- 5.5.2.3 France
- 5.5.2.4 Italy
- 5.5.2.5 Rest of Europe
- 5.5.3 Asia-Pacific
- 5.5.3.1 China
- 5.5.3.2 Japan
- 5.5.3.3 India
- 5.5.3.4 South Korea
- 5.5.3.5 Rest of Asia-Pacific
- 5.5.4 Middle East
- 5.5.4.1 Israel
- 5.5.4.2 Saudi Arabia
- 5.5.4.3 United Arab Emirates
- 5.5.4.4 Turkey
- 5.5.4.5 Rest of Middle East
- 5.5.5 Africa
- 5.5.5.1 South Africa
- 5.5.5.2 Egypt
- 5.5.5.3 Rest of Africa
- 5.5.6 South America
- 5.5.6.1 Brazil
- 5.5.6.2 Argentina
- 5.5.6.3 Rest of South America
- 5.5.1 North America
6 COMPETITIVE LANDSCAPE
- 6.1 Market Concentration
- 6.2 Strategic Moves
- 6.3 Market Share Analysis
- 6.4 Company Profiles (includes Global Level Overview, Market Level Overview, Core Segments, Financials as available, Strategic Information, Market Rank/Share, Products and Services, Recent Developments)
- 6.4.1 VusionGroup S.A.
- 6.4.2 Pricer AB
- 6.4.3 Hanshow Technology Co., Ltd.
- 6.4.4 Displaydata Limited
- 6.4.5 SoluM Co., Ltd.
- 6.4.6 Opticon Sensors Europe B.V.
- 6.4.7 E Ink Holdings Inc.
- 6.4.8 Keonn Technologies S.L.
- 6.4.9 RAINUS Co., Ltd.
- 6.4.10 Avery Dennison Corporation
- 6.4.11 Zebra Technologies Corporation
- 6.4.12 Honeywell International Inc.
- 6.4.13 Impinj, Inc.
- 6.4.14 Trax Technology Solutions Pte. Ltd.
- 6.4.15 Focal Systems Inc.
- 6.4.16 Digi International Inc.
- 6.4.17 Checkpoint Systems, Inc.
- 6.4.18 SATO Holdings Corporation
- 6.4.19 Teraoka Seiko Co., Ltd.
- 6.4.20 Altierre Corporation
7 MARKET OPPORTUNITIES AND FUTURE OUTLOOK
- 7.1 White-Space and Unmet-Need Assessment

