
PUBLISHER: Global Market Insights Inc. | PRODUCT CODE: 1936597

PUBLISHER: Global Market Insights Inc. | PRODUCT CODE: 1936597
Electronic Shelf Label Market Opportunity, Growth Drivers, Industry Trend Analysis, and Forecast 2026 - 2035
The Global Electronic Shelf Label Market was valued at USD 2.2 billion in 2025 and is estimated to grow at a CAGR of 12.7% to reach USD 7.4 billion by 2035.
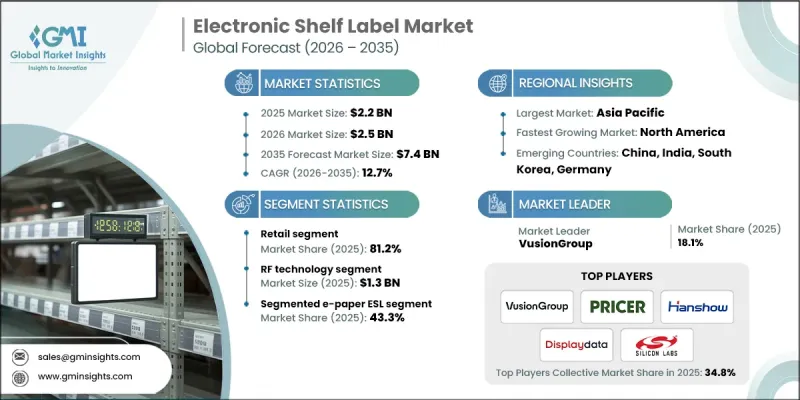
Market expansion is driven by the growing demand for retail automation, the rising adoption of dynamic pricing strategies fueled by e-commerce competition, and consumers' increasing expectations for accurate, transparent pricing. IoT-enabled ESLs allow retailers to seamlessly integrate pricing with store operations, inventory systems, and supply chains, enabling real-time updates, automated alerts, and improved operational visibility. Retailers are increasingly combining ESLs with analytics platforms to enhance pricing strategies. AI-based solutions improve price accuracy by analyzing sales velocity, consumer behavior patterns, and demand trends, empowering retailers to make informed decisions and optimize profitability across multiple channels.
| Market Scope | |
|---|---|
| Start Year | 2025 |
| Forecast Year | 2026-2035 |
| Start Value | $2.2 Billion |
| Forecast Value | $7.4 Billion |
| CAGR | 12.7% |
The full-graphic e-paper ESL segment is forecasted to grow at a CAGR of 16.5% through 2035, driven by retailers' desire for superior visualization capabilities. Unlike conventional ESLs, full-graphic e-paper displays support images, layouts, fonts, and rich content beyond simple price tags. Retailers can now showcase product images, nutritional information, allergen warnings, promotional graphics, and QR codes for additional details, enhancing the overall shopping experience and customer engagement. This feature makes full-graphic ESLs particularly appealing for supermarkets, specialty stores, and high-end retail environments, where visual merchandising and brand messaging are critical.
The RF technology segment reached USD 1.3 billion in 2025, due to its technical advantages. RF signals provide extensive coverage and allow the deployment of centralized base stations, ensuring consistent operation even in challenging retail environments. RF technology performs reliably despite interference from metal shelving, inventory, or heavy customer traffic, making it the preferred choice for large-scale retail operations. Its robustness and adaptability have reinforced its market leadership in ESL applications, particularly in high-volume retail chains and hypermarkets.
North America Electronic Shelf Label Market held 31% share in 2025. Growth in this region is fueled by strong demand for retail automation, dynamic pricing solutions, and improved consumer engagement. Retailers are increasingly deploying ESL systems to reduce labor costs, enhance pricing accuracy, and simplify inventory management across supermarkets, hypermarkets, and specialty outlets. Governments and private enterprises are investing in IoT-connected, cloud-managed ESL platforms to enable real-time price updates, ensure consistent pricing across multiple locations, and leverage data-driven insights. The U.S. remains the core market, with high adoption rates driven by advanced retail technology infrastructure and regulatory encouragement of digital pricing systems.
Key players active in the Global Electronic Shelf Label Market include Delfi Technologies A/S, Displaydata Ltd, Hangzhou Zkong Networks Co., Ltd., Hanshow Technology, Infotek Software & Systems (P) Ltd., M2COMM, Minewtag, Opticon, Panasonic Connect Co., Ltd., Pricer, Sen Security Solutions, Shanghai SUNMI Technology Co., Ltd., Silicon Laboratories, SOLUM, Teraoka (Pty) Ltd, VusionGroup, Ynvisible Interactive Inc., and ComQi. Companies in the Electronic Shelf Label Market are implementing a combination of strategic approaches to strengthen their market presence and expand their foothold. These include investing heavily in R&D to improve display technology, battery life, and IoT connectivity, as well as developing AI-integrated software for dynamic pricing and real-time analytics. Firms are forging strategic partnerships with retail chains, distributors, and technology providers to broaden distribution and integration capabilities. Expanding into emerging markets and customizing products for local regulatory and consumer requirements allows companies to capture untapped growth opportunities.
Table of Contents
Chapter 1 Methodology and Scope
- 1.1 Market scope and definition
- 1.2 Research design
- 1.2.1 Research approach
- 1.2.2 Data collection methods
- 1.3 Data mining sources
- 1.3.1 Global
- 1.3.2 Regional/Country
- 1.4 Base estimates and calculations
- 1.4.1 Base year calculation
- 1.4.2 Key trends for market estimation
- 1.5 Primary research and validation
- 1.5.1 Primary sources
- 1.6 Forecast model
- 1.7 Research assumptions and limitations
Chapter 2 Executive Summary
- 2.1 Industry 3600 synopsis, 2022 - 2035
- 2.2 Key market trends
- 2.2.1 Product type trends
- 2.2.2 Display size trends
- 2.2.3 Technology trends
- 2.2.4 Application trends
- 2.2.5 Regional trends
- 2.3 TAM Analysis, 2026-2035
- 2.4 CXO perspectives: Strategic imperatives
- 2.4.1 Executive decision points
- 2.4.2 critical success factors
- 2.5 Future outlook and strategic recommendations
Chapter 3 Industry Insights
- 3.1 Industry ecosystem analysis
- 3.1.1 Supplier Landscape
- 3.1.2 Profit Margin
- 3.1.3 Cost structure
- 3.1.4 Value addition at each stage
- 3.1.5 Factor affecting the value chain
- 3.1.6 Disruptions
- 3.2 Industry impact forces
- 3.2.1 Growth drivers
- 3.2.1.1 Rising retail automation increases real-time pricing updates
- 3.2.1.2 E-commerce competition drives dynamic pricing adoption
- 3.2.1.3 IoT connectivity enhances ESL system integration
- 3.2.1.4 Energy-efficient displays reduce operational costs significantly
- 3.2.1.5 Consumer preference for accurate pricing encourages adoption
- 3.2.2 Industry pitfalls and challenges
- 3.2.2.1 High initial deployment costs limit adoption
- 3.2.2.2 Integration issues with legacy store systems
- 3.2.3 Market opportunities
- 3.2.3.1 AI-driven pricing enables intelligent retail decision-making
- 3.2.3.2 Emerging markets offer rapid ESL adoption potential
- 3.2.1 Growth drivers
- 3.3 Growth potential analysis
- 3.4 Regulatory landscape
- 3.4.1 North America
- 3.4.2 Europe
- 3.4.3 Asia Pacific
- 3.4.4 Latin America
- 3.4.5 Middle East & Africa
- 3.5 Porter's analysis
- 3.6 PESTEL analysis
- 3.7 Technology and Innovation landscape
- 3.7.1 Current technological trends
- 3.7.2 Emerging technologies
- 3.8 Price trends
- 3.8.1 By region
- 3.8.2 By product
- 3.9 Pricing Strategies
- 3.10 Emerging Business Models
- 3.11 Compliance Requirements
- 3.12 Patent and IP analysis
- 3.13 Geopolitical and trade dynamics
Chapter 4 Competitive Landscape, 2025
- 4.1 Introduction
- 4.2 Company market share analysis
- 4.2.1 By region
- 4.2.1.1 North America
- 4.2.1.2 Europe
- 4.2.1.3 Asia Pacific
- 4.2.1.4 Latin America
- 4.2.1.5 Middle East & Africa
- 4.2.2 Market concentration analysis
- 4.2.1 By region
- 4.3 Competitive benchmarking of key players
- 4.3.1 Financial performance comparison
- 4.3.1.1 Revenue
- 4.3.1.2 Profit margin
- 4.3.1.3 R&D
- 4.3.2 Product portfolio comparison
- 4.3.2.1 Product range breadth
- 4.3.2.2 Technology
- 4.3.2.3 Innovation
- 4.3.3 Geographic presence comparison
- 4.3.3.1 Global footprint analysis
- 4.3.3.2 Service network coverage
- 4.3.3.3 Market penetration by region
- 4.3.4 Competitive positioning matrix
- 4.3.4.1 Leaders
- 4.3.4.2 Challengers
- 4.3.4.3 Followers
- 4.3.4.4 Niche players
- 4.3.5 Strategic outlook matrix
- 4.3.1 Financial performance comparison
- 4.4 Key developments
- 4.4.1 Mergers and acquisitions
- 4.4.2 Partnerships and collaborations
- 4.4.3 Technological advancements
- 4.4.4 Expansion and investment strategies
- 4.4.5 Digital transformation initiatives
- 4.5 Emerging/ startup competitors landscape
Chapter 5 Market Estimates and Forecast, By Product Type, 2022 - 2035 (USD Million & Units)
- 5.1 Key trends
- 5.2 LCD ESL
- 5.3 Segmented E-paper ESL
- 5.4 Full-graphic E-paper ESL
Chapter 6 Market Estimates and Forecast, By Display Size, 2022 - 2035 (USD Million & Units)
- 6.1 Key trends
- 6.2 Small (≤2 inches)
- 6.3 Medium (2-5 inches)
- 6.4 Large (>5 inches)
Chapter 7 Market Estimates and Forecast, By Technology, 2022 - 2035 (USD Million & Units)
- 7.1 Key trends
- 7.2 Radio frequency (RF)
- 7.3 Infrared (IR)
- 7.4 Near field communication (NFC)
- 7.5 Bluetooth
- 7.6 Others
Chapter 8 Market Estimates and Forecast, By Application, 2022 - 2035 (USD Million & Units)
- 8.1 Key trends
- 8.2 Retail
- 8.2.1 Supermarkets / hypermarkets
- 8.2.2 Convenience stores / retail chains
- 8.2.3 Electronics & appliance stores
- 8.2.4 Pharmacies
- 8.2.5 Others
- 8.3 Industrial
- 8.3.1 Industrial facilities
- 8.3.2 Warehouses
- 8.3.3 Distribution centers
- 8.3.4 Others
- 8.4 Others
Chapter 9 Market Estimates and Forecast, By Region, 2022 - 2035 (USD Million & Units)
- 9.1 Key trends
- 9.2 North America
- 9.2.1 U.S.
- 9.2.2 Canada
- 9.3 Europe
- 9.3.1 Germany
- 9.3.2 UK
- 9.3.3 France
- 9.3.4 Spain
- 9.3.5 Italy
- 9.4 Asia Pacific
- 9.4.1 China
- 9.4.2 India
- 9.4.3 Japan
- 9.4.4 Australia
- 9.4.5 South Korea
- 9.5 Latin America
- 9.5.1 Brazil
- 9.5.2 Mexico
- 9.5.3 Argentina
- 9.6 Middle East and Africa
- 9.6.1 South Africa
- 9.6.2 Saudi Arabia
- 9.6.3 UAE
Chapter 10 Company Profiles
- 10.1 Global Key Players
- 10.1.1 Delfi Technologies A/S
- 10.1.2 Panasonic Connect Co., Ltd.
- 10.1.3 Pricer
- 10.1.4 Silicon Laboratories
- 10.2 Regional key players
- 10.2.1 North America
- 10.2.1.1 ComQi
- 10.2.1.2 Infotek Software & Systems (P) Ltd.
- 10.2.1.3 VusionGroup
- 10.2.2 Asia Pacific
- 10.2.2.1 Hangzhou Zkong Networks Co., Ltd.
- 10.2.2.2 Shanghai SUNMI Technology Co., Ltd.
- 10.2.2.3 SOLUM
- 10.2.2.4 Minewtag
- 10.2.3 Europe
- 10.2.3.1 Displaydata Ltd
- 10.2.3.2 Hanshow Technology
- 10.2.3.3 Teraoka (Pty) Ltd
- 10.2.1 North America
- 10.3 Niche Players/Disruptors
- 10.3.1 M2COMM
- 10.3.2 Opticon
- 10.3.3 Sen Security Solutions
- 10.3.4 Ynvisible Interactive Inc.

