
PUBLISHER: Mordor Intelligence | PRODUCT CODE: 2066755

PUBLISHER: Mordor Intelligence | PRODUCT CODE: 2066755
Textile Recycling - Market Share Analysis, Industry Trends & Statistics, Growth Forecasts (2026 - 2031)
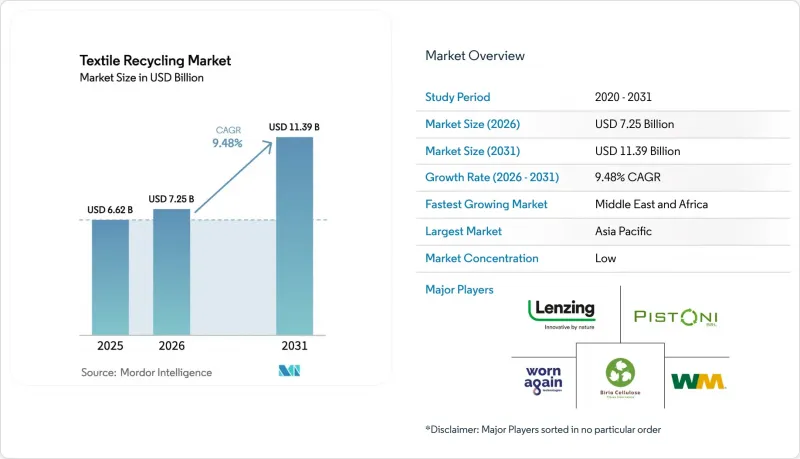
According to Mordor Intelligence, the textile recycling market size was valued at USD 6.62 billion in 2025 and is estimated to grow from USD 7.25 billion in 2026 to reach USD 11.39 billion by 2031, at a CAGR of 9.48% during the forecast period (2026-2031).
This report is Segmented by Material (Cotton, Polyester & Polyester Fiber, and Others), by Waste Source (Pre-Consumer and Post-Consumer), by End-User Application (Apparel & Fashion, Industrial, and Others), by Recycling Process (Mechanical, Chemical, and Others), and by Geography (North America, South America, Europe, Asia-Pacific, and Others). The Market Forecasts are Provided in Terms of Value (USD).
Global Textile Recycling Market Trends and Insights
Green Deal-driven Extended Producer Responsibility Rollout in the EU
Mandatory separate textile collection begins across the bloc in January 2025, shifting disposal costs to producers through eco-modulated fees. France already channels about EUR 100 million a year from its scheme into collection infrastructure that processes 240,000 tons of waste. Early adopters such as the Netherlands hit 50% recycling rates two years ahead of the EU target, demonstrating scalability. California's SB 707 mirrors the model, preventing regulatory arbitrage and standardising minimum recycling thresholds. Predictable fee income lowers project risk, accelerating deployments of regional processing hubs.
Fast-fashion Brand Commitments to >=50% Recycled Fiber by 2026
H&M Group's seven-year USD 600 million offtake deal with Syre underscores how purchase guarantees are derisking chemical-recycling investments. Gap Inc. and Carter's share comparable supply-chain goals, pushing aggregate contracted demand above USD 2 billion. Recycled polyester currently commands 15-20% price premiums over virgin equivalents, strengthening revenue visibility for suppliers. Long-term contracts reduce customer acquisition cost and support debt-financed facility builds, especially in Asia and Europe, where brands maintain production clusters.
High CAPEX & Energy-intensive Chemical Lines Limiting Commercialisation
Typical units require USD 200-500 million, and energy demand ranges from 15-25 GJ per ton, fivefold the mechanical alternative. Renewcell's 2024 bankruptcy illustrated financing fragility despite brand partnerships. Subsidies such as Eastman's now-revoked Department of Energy grant highlight reliance on policy support. Capital intensity often localises projects in OECD regions, leaving feedstock-rich emerging markets underserved.
Other drivers and restraints analyzed in the detailed report include:
- Chemical depolymerisation scale-ups unlocking closed-loop polyester
- China Landfill and Incineration Quotas Forcing Domestic Mill Recycling Investments
- Fiber-blend Contamination Complicating Automated Sorting & Yield
For complete list of drivers and restraints, kindly check the Table Of Contents.
Segment Analysis
Polyester accounted for 44.30% of the textile recycling market in 2025 on the back of established PET supply chains and consumer familiarity. Mechanical processes handle clear streams efficiently, while chemical depolymerisation eliminates quality drop-offs, widening usage in high-end apparel. The nylon segment is expanding at 9.41% CAGR, buoyed by automotive and sportswear blends that demand high tensile strength. Technologies such as ECONYL feed closed-loop loops, signalling commercial readiness. Cotton encounters policy limits in China, but blend-recovery chemistries like REFIBRA open incremental niches. Smaller categories, wool, silk, and acrylic advance as pilot lines prove technical feasibility, and brands diversify raw-material strategies.
Post-consumer streams held a 60.40% share of the textile recycling market in 2025, reflecting landfill diversion mandates and established charity-collection networks. Yet pre-consumer waste is projected to expand at 8.52% CAGR as factory off-cuts deliver uniform composition, higher yields, and 20-30% value premiums. The EU separate-collection rule, effective in 2025, will double regional post-consumer volumes by 2030, squeezing margins unless automated sorting improves. Digital passports and colour-sort robotics are emerging fixes that can unlock latent value by boosting identification accuracy.
Geography Analysis
Asia-Pacific led the textile recycling market with a 46.10% share in 2025, anchored by massive fiber production and export-oriented apparel hubs that generate sizeable scrap volumes. China's 26 million-ton waste stream dwarfs global peers, yet recycled-content restrictions funnel much of the output abroad, muting domestic demand. Vietnam emerges as a preferred build site for gigascale plants because of policy incentives and proximity to manufacturing clusters. India lags on infrastructure: only 13% of waste is reused, but central-government initiatives and private partnerships are gaining traction.
The Middle East and Africa is the fastest-growing region in the textile recycling market at an 8.74% CAGR. UAE programs such as Circulife pair retail-collection drives with processing capacity, positioning the Gulf as a regional recycling hub. Turkey leverages its customs-union status with the EU to import European post-consumer bales, process them cost-effectively and re-export yarns, tapping an under-served adjacency between two large consumption zones.
Europe acts as the regulatory bellwether in the textile recycling market; EPR implementation starting 2025 is projected to lift collected volumes to 4.5-7.2 million tons by 2030. North America follows with state-level mandates like California's SB 707 and federal coordination efforts that could unlock a USD 1.5 billion fiber-to-fiber opportunity. South America's incipient projects in Brazil and Chile illustrate growing interest, especially where governments view recycling as a job-creation lever.
- Lenzing AG
- Birla Cellulose (Aditya Birla)
- Unifi Inc.
- Renewcell AB
- Worn Again Technologies
- Waste Management Inc.
- American Textile Recycling Service
- Boer Group Recycling Solutions
- I:Collect GmbH (I:CO)
- Infinited Fiber Co.
- Eastman Chemical Co. (Naia(TM) Renew)
- Circ LLC
- Carbios SA
- Loop Industries Inc.
- Soex Group
- Textile Recycling International
- Evrnu SPC
- Pistoni SRL
- Gemini Corporation NV
- The Woolmark Company*
Additional Benefits:
- The market estimate (ME) sheet in Excel format
- 3 months of analyst support
TABLE OF CONTENTS
1 Introduction
- 1.1 Study Assumptions & Market Definition
- 1.2 Scope of the Study
2 Research Methodology
3 Executive Summary
4 Market Landscape
- 4.1 Market Overview
- 4.2 Market Drivers
- 4.2.1 Green Deal-Driven Extended Producer Responsibility (EPR) Roll-out in the EU
- 4.2.2 Fast-Fashion Brand Commitments to >=50 % Recycled Fiber by 2026
- 4.2.3 Chemical Depolymerisation Scale-ups Unlocking Closed-Loop Polyester
- 4.2.4 China's Landfill/Incineration Quotas Forcing Domestic Mill Recycling Investments
- 4.2.5 Block-Chain Traceability Platforms (e.g., TextileGenesis) Boosting Brand Acceptance
- 4.2.6 Automotive NVH Demand for Recycled Non-wovens in North America
- 4.3 Market Restraints
- 4.3.1 High-CAPEX & Energy-Intensive Chemical Lines Limiting Commercialisation
- 4.3.2 Fiber-Blend Contamination Complicating Automated Sorting & Yield
- 4.3.3 Absence of Bale-Grade Pricing Benchmarks Dampening Investor Confidence
- 4.3.4 Fragmented Collection Infrastructure in US & Emerging Asia
- 4.4 Value / Supply-Chain Analysis
- 4.5 Regulatory Outlook
- 4.6 Technological Outlook
- 4.7 Industry Attractiveness - Porter's Five Forces
- 4.7.1 Bargaining Power of Suppliers
- 4.7.2 Bargaining Power of Buyers
- 4.7.3 Threat of New Entrants
- 4.7.4 Threat of Substitutes
- 4.7.5 Intensity of Competitive Rivalry
5 Market Size & Growth Forecasts (Value, USD Billion)
- 5.1 By Material
- 5.1.1 Cotton
- 5.1.2 Polyester & Polyester Fiber
- 5.1.3 Wool
- 5.1.4 Nylon & Nylon Fiber
- 5.1.5 Others (Silk, Acrylic, Blends)
- 5.2 By Waste Source
- 5.2.1 Pre-consumer (Factory off-cuts, Yarn waste)
- 5.2.2 Post-consumer (Discarded Garments & Household Textiles)
- 5.3 By Application End-user
- 5.3.1 Apparel & Fashion
- 5.3.2 Industrial (Wipes, Filtration, Safety Gear)
- 5.3.3 Home Furnishings & Carpets
- 5.3.4 Automotive & Transportation
- 5.3.5 Building & Construction
- 5.3.6 Others (Retail/Consumer Products, etc.)
- 5.4 By Recycling Process
- 5.4.1 Mechanical Recycling
- 5.4.2 Chemical Recycling (Depolymerisation, Dissolution)
- 5.4.3 Thermal/Energy Recovery
- 5.5 By Geography
- 5.5.1 North America
- 5.5.1.1 United States
- 5.5.1.2 Canada
- 5.5.1.3 Mexico
- 5.5.2 South America
- 5.5.2.1 Brazil
- 5.5.2.2 Argentina
- 5.5.2.3 Chile
- 5.5.2.4 Rest of South America
- 5.5.3 Europe
- 5.5.3.1 Germany
- 5.5.3.2 United Kingdom
- 5.5.3.3 France
- 5.5.3.4 Italy
- 5.5.3.5 Spain
- 5.5.3.6 BENELUX (Belgium, Netherlands, and Luxembourg)
- 5.5.3.7 NORDICS (Denmark, Finland, Iceland, Norway, and Sweden)
- 5.5.3.8 Rest of Europe
- 5.5.4 Asia-Pacific
- 5.5.4.1 China
- 5.5.4.2 India
- 5.5.4.3 Japan
- 5.5.4.4 South Korea
- 5.5.4.5 ASEAN (Indonesia, Thailand, Philippines, Malaysia, Vietnam)
- 5.5.4.6 Rest of Asia-Pacific
- 5.5.5 Middle East and Africa
- 5.5.5.1 Saudi Arabia
- 5.5.5.2 United Arab Emirates
- 5.5.5.3 Turkey
- 5.5.5.4 South Africa
- 5.5.5.5 Nigeria
- 5.5.5.6 Egypt
- 5.5.5.7 Rest of Middle East and Africa
- 5.5.1 North America
6 Competitive Landscape
- 6.1 Market Concentration
- 6.2 Strategic Moves (M&A, Capacity Adds, Brand Off-take Deals)
- 6.3 Market Share Analysis
- 6.4 Company Profiles {(includes Global level Overview, Market level overview, Core Segments, Financials as available, Strategic Information, Products & Services, and Recent Developments)}
- 6.4.1 Lenzing AG
- 6.4.2 Birla Cellulose (Aditya Birla)
- 6.4.3 Unifi Inc.
- 6.4.4 Renewcell AB
- 6.4.5 Worn Again Technologies
- 6.4.6 Waste Management Inc.
- 6.4.7 American Textile Recycling Service
- 6.4.8 Boer Group Recycling Solutions
- 6.4.9 I:Collect GmbH (I:CO)
- 6.4.10 Infinited Fiber Co.
- 6.4.11 Eastman Chemical Co. (Naia(TM) Renew)
- 6.4.12 Circ LLC
- 6.4.13 Carbios SA
- 6.4.14 Loop Industries Inc.
- 6.4.15 Soex Group
- 6.4.16 Textile Recycling International
- 6.4.17 Evrnu SPC
- 6.4.18 Pistoni SRL
- 6.4.19 Gemini Corporation NV
- 6.4.20 The Woolmark Company*
7 Market Opportunities & Future Outlook
- 7.1 White-space & Unmet-Need Assessment

