
PUBLISHER: Mordor Intelligence | PRODUCT CODE: 2072447

PUBLISHER: Mordor Intelligence | PRODUCT CODE: 2072447
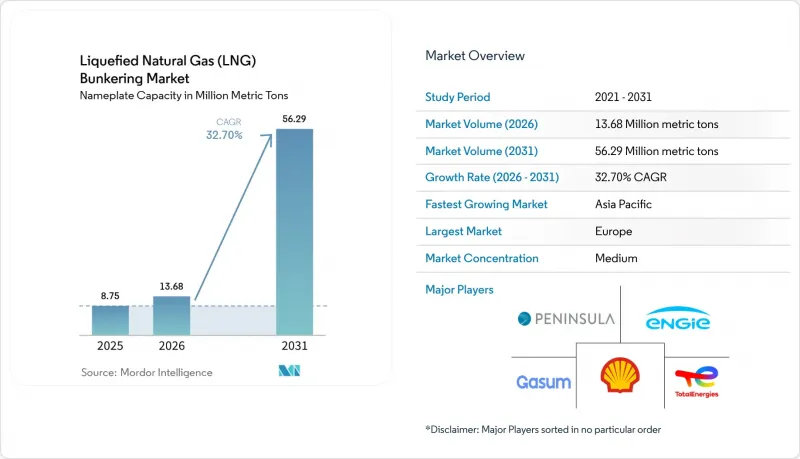
Liquefied Natural Gas (LNG) Bunkering - Market Share Analysis, Industry Trends & Statistics, Growth Forecasts (2026 - 2031)
According to Mordor Intelligence, the liquefied natural gas bunkering market size in terms of nameplate capacity is projected to be 8.75 million metric tons in 2025, 13.68 million metric tons in 2026, and reach 56.29 million metric tons by 2031, growing at a CAGR of 32.70% from 2026 to 2031.
This report is Segmented by End User (Tanker Fleet, Container Fleet, Bulk and General Cargo Fleet, Ferries and OSV, and Other End-Users) and Geography (North America, Europe, Asia-Pacific, South America, and Middle East and Africa). The Market Sizes and Forecasts are Provided in Terms of Volume (Metric Tons).
Global Liquefied Natural Gas (LNG) Bunkering Market Trends and Insights
IMO 2020 Sulphur-Cap Compliance Push
The 0.5% sulfur cap that entered into force in 2020 eliminated the cost advantage of high-sulfur fuel oil, leaving owners with scrubbers, very-low-sulfur fuel oil, or LNG. Scrubber retrofits stabilized near 5,000 vessels by 2024, while LNG retained a USD 150-250 per metric-ton price edge over VLSFO in major hub ports, tipping newbuild decisions toward dual-fuel engines. Intensified port-state inspections in Singapore and Rotterdam during 2025 raised the cost of non-compliance, accelerating fleet renewal toward LNG-capable tonnage.
Rapid Growth in LNG-Powered Vessel Orderbook
Classification-society data showed 535 LNG-powered ships in service and 509 on order as of April 2024, with container ships accounting for over half of capacity. CMA CGM alone contracted 77 LNG-fueled vessels, taking delivery of 44 by mid-2025. The concentration of orders in large container units has created a virtuous loop of predictable fuel demand that underpins further infrastructure spending in hub ports.
High CAPEX for Bunkering Vessels and Shore Tanks
A 7,500 cubic-meter bunkering vessel demands USD 60-75 million to build and up to USD 8 million annually for operations. Shore-tank investments exceed USD 120 million and involve 24-month permitting under ISO 20519 and the IGF Code, which delays projects in emerging markets. This cost hurdle forces operators on secondary routes to detour to major hubs or carry additional fuel, eroding LNG's economic advantage.
Other drivers and restraints analyzed in the detailed report include:
- Expansion of Global LNG Bunkering Infrastructure
- Cost Competitiveness of LNG Versus Low-Sulphur Fuel Oils
- Methane-Slip and Life-Cycle GHG Concerns
For complete list of drivers and restraints, kindly check the Table Of Contents.
Segment Analysis
Container fleet operations accounted for 39.7% of the LNG bunkering market size in 2025 and are projected to grow at a 35.8% CAGR through 2031. CMA CGM's fleet of 44 operational LNG-powered vessels and 33 additional units on order illustrates the scale commitment by mega-carriers. The ability to negotiate long-term supply contracts and secure priority berths in hub ports underpins adoption. Tanker fleet uptake remains below 2% of the newbuild pipeline because charterers resist freight premiums, and loading terminals in the Middle East and West Africa lack LNG infrastructure. Bulk and general cargo operators face similar obstacles, as cargo-hold space is sacrificed to fuel tanks, and freight markets remain fragmented.
The LNG bunkering market continues to depend on container traffic along Asia-Europe and trans-Pacific corridors, reinforcing infrastructure concentration in Singapore, Rotterdam, and the U.S. Gulf. Ferries and offshore-support vessels in Norway benefit from subsidies that offset 40% of conversion costs, while cruise lines deploy LNG to meet port-city air-quality mandates in the Mediterranean and Caribbean. Future growth hinges on whether IMO tightens 2030 and 2040 carbon-intensity goals enough to tip investment toward methanol or ammonia. Early evidence suggests container carriers will maintain LNG commitments because network volume allows hedging against fuel-price swings and amortizing capital costs across large fleets.
Complete Report Scope:
- By End User
- Tanker Fleet
- Container Fleet
- Bulk and General Cargo Fleet
- Ferries and OSV
- Other End-Users
- By Geography
- North America
- United States
- Canada
- Mexico
- Europe
- Germany
- France
- Spain
- Italy
- Netherlands
- Sweden
- Belgium
- Russia
- Rest of Europe
- Asia-Pacific
- China
- Japan
- South Korea
- Singapore
- Malaysia
- Australia
- Rest of Asia-Pacific
- South America
- Brazil
- Panama
- Argentina
- Rest of South America
- Middle East and Africa
- United Arab Emirates
- Saudi Arabia
- Oman
- South Africa
- Egypt
- Rest of Middle East and Africa
- North America
Geography Analysis
Europe captured 72.4% of the LNG bunkering market share in 2025, supported by early regulatory moves, dense short-sea networks, and the continent's mature shore infrastructure. Rotterdam, Antwerp, and Scandinavian ports offered simultaneous bunkering for more than 40 vessels by mid-2025. Germany's repurposed FSRU terminals at Brunsbuttel and Wilhelmshaven added LNG bunkering capability in 2024, serving Baltic and North Sea routes. Updated European Maritime Safety Agency guidelines harmonized safety protocols and simplified cross-border operations in 2024.
Asia-Pacific is forecast to grow at a 40.5% CAGR through 2031, propelled by Singapore's second terminal, China's Zhoushan expansion, and South Korea's deployment of dedicated bunkering vessels. Singapore's bunkering capacity rose to 12 simultaneous operations in 2024, supporting liner volumes through the Malacca Strait. In China, Zhoushan's 30,000 cubic-meter shore tanks opened in early 2025, serving domestic coastal feeders and bulk trades. Japan and South Korea favor bunkering vessels over shore tanks to limit upfront capital, though this strategy caps throughput and may require additional assets as the fleet grows.
North America remains a niche, with the U.S. Gulf accounting for most regional volumes. Harvey Gulf operates two bunkering vessels serving offshore supply and container feeders, while West Coast and Canadian ports await clearer regulatory frameworks. South America and the Middle East & Africa contributed less than 3% of 2025 volumes. Petrobras paused expansion in Santos pending domestic gas-price reforms, and Panama lacks LNG storage, diverting bunkering demand to the U.S. Gulf. QatarEnergy's Q-LNG ordered a bunkering vessel in 2025 for delivery in 2027 to serve Hamad Port, signaling future growth potential in the Middle East.
- Shell plc
- TotalEnergies SE
- Gasum Oy
- ENGIE SA
- Peninsula Petroleum
- ENN Energy Holdings
- Korea Gas Corporation (KOGAS)
- Harvey Gulf International Marine
- Gazprom Neft PJSC
- Naturgy Energy Group
- Titan Clean Fuels
- Crowley Maritime Corp.
- CMA CGM SA
- MOL (LNG Solutions)
- NYK Line
- QatarEnergy (Q-LNG)
- ExxonMobil Marine Fuels
- Petronas Marine
- Bunker Holding A/S
- GTT (Gaztransport & Technigaz)
- Cryostar SAS
Additional Benefits:
- The market estimate (ME) sheet in Excel format
- 3 months of analyst support
TABLE OF CONTENTS
1 Introduction
- 1.1 Study Assumptions & Market Definition
- 1.2 Scope of the Study
2 Research Methodology
3 Executive Summary
4 Market Landscape
- 4.1 Market Overview
- 4.2 Market Drivers
- 4.2.1 IMO 2020 sulphur-cap compliance push
- 4.2.2 Rapid growth in LNG-powered vessel orderbook
- 4.2.3 Expansion of global LNG bunkering infrastructure
- 4.2.4 Cost competitiveness of LNG versus low-sulphur fuel oils
- 4.2.5 Emergence of e-methane enabling carbon-neutral LNG supply
- 4.2.6 Automation & digital-twin solutions improving bunkering safety
- 4.3 Market Restraints
- 4.3.1 High CAPEX for bunkering vessels & shore tanks
- 4.3.2 Volatility of LNG spot prices
- 4.3.3 Methane-slip and life-cycle GHG concerns
- 4.3.4 Rising investment shift toward methanol & ammonia bunkering
- 4.4 Supply-Chain Analysis
- 4.5 Regulatory Landscape
- 4.6 Technological Outlook
- 4.7 Porter's Five Forces
- 4.7.1 Bargaining Power of Suppliers
- 4.7.2 Bargaining Power of Buyers
- 4.7.3 Threat of New Entrants
- 4.7.4 Threat of Substitutes
- 4.7.5 Competitive Rivalry
5 Market Size & Growth Forecasts
- 5.1 By End User
- 5.1.1 Tanker Fleet
- 5.1.2 Container Fleet
- 5.1.3 Bulk and General Cargo Fleet
- 5.1.4 Ferries and OSV
- 5.1.5 Other End-Users
- 5.2 By Geography
- 5.2.1 North America
- 5.2.1.1 United States
- 5.2.1.2 Canada
- 5.2.1.3 Mexico
- 5.2.2 Europe
- 5.2.2.1 Germany
- 5.2.2.2 France
- 5.2.2.3 Spain
- 5.2.2.4 Italy
- 5.2.2.5 Netherlands
- 5.2.2.6 Sweden
- 5.2.2.7 Belgium
- 5.2.2.8 Russia
- 5.2.2.9 Rest of Europe
- 5.2.3 Asia-Pacific
- 5.2.3.1 China
- 5.2.3.2 Japan
- 5.2.3.3 South Korea
- 5.2.3.4 Singapore
- 5.2.3.5 Malaysia
- 5.2.3.6 Australia
- 5.2.3.7 Rest of Asia-Pacific
- 5.2.4 South America
- 5.2.4.1 Brazil
- 5.2.4.2 Panama
- 5.2.4.3 Argentina
- 5.2.4.4 Rest of South America
- 5.2.5 Middle East and Africa
- 5.2.5.1 United Arab Emirates
- 5.2.5.2 Saudi Arabia
- 5.2.5.3 Oman
- 5.2.5.4 South Africa
- 5.2.5.5 Egypt
- 5.2.5.6 Rest of Middle East and Africa
- 5.2.1 North America
6 Competitive Landscape
- 6.1 Market Concentration
- 6.2 Strategic Moves (M&A, Partnerships, PPAs)
- 6.3 Market Share Analysis (Market Rank/Share for key companies)
- 6.4 Company Profiles (includes Global level Overview, Market level overview, Core Segments, Financials as available, Strategic Information, Products & Services, and Recent Developments)
- 6.4.1 Shell plc
- 6.4.2 TotalEnergies SE
- 6.4.3 Gasum Oy
- 6.4.4 ENGIE SA
- 6.4.5 Peninsula Petroleum
- 6.4.6 ENN Energy Holdings
- 6.4.7 Korea Gas Corporation (KOGAS)
- 6.4.8 Harvey Gulf International Marine
- 6.4.9 Gazprom Neft PJSC
- 6.4.10 Naturgy Energy Group
- 6.4.11 Titan Clean Fuels
- 6.4.12 Crowley Maritime Corp.
- 6.4.13 CMA CGM SA
- 6.4.14 MOL (LNG Solutions)
- 6.4.15 NYK Line
- 6.4.16 QatarEnergy (Q-LNG)
- 6.4.17 ExxonMobil Marine Fuels
- 6.4.18 Petronas Marine
- 6.4.19 Bunker Holding A/S
- 6.4.20 GTT (Gaztransport & Technigaz)
- 6.4.21 Cryostar SAS
7 Market Opportunities & Future Outlook
- 7.1 White-space & Unmet-Need Assessment

