
PUBLISHER: Mordor Intelligence | PRODUCT CODE: 2072867

PUBLISHER: Mordor Intelligence | PRODUCT CODE: 2072867
Foodservice Coffee - Market Share Analysis, Industry Trends & Statistics, Growth Forecasts (2026 - 2031)
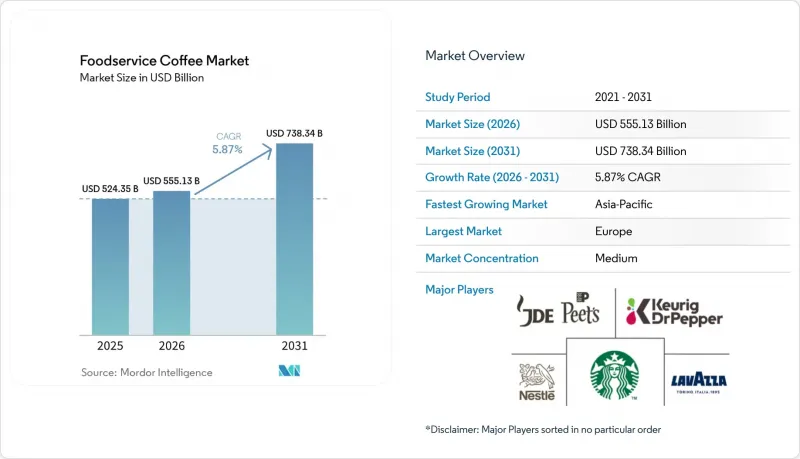
According to Mordor Intelligence, the foodservice coffee market size is expected to increase from USD 524.35 billion in 2025 to USD 555.13 billion in 2026 and reach USD 738.34 billion by 2031, growing at a CAGR of 5.9% over 2026-2031.
This report is Segmented by Outlet Type (Chained and Independent), Service Format (Dine-In, Takeaway, and Delivery), End Use (Coffee Shops and Cafes, Hotels and Resorts, and More), and Geography (North America, Europe, Asia-Pacific, South America, and Middle East and Africa). The Market Forecasts are Provided in Terms of Value (USD).
Global Foodservice Coffee Market Trends and Insights
Rising cafe culture and social coffee consumption
The foodservice coffee market is growing as cafe culture becomes more popular and coffee shops increasingly serve as places for socializing, working, and relaxing. People are not just visiting cafes for coffee but also for the overall experience, such as meeting friends, holding informal meetings, or enjoying a comfortable environment. This has led to more frequent visits and stronger customer loyalty. Younger consumers, in particular, are driving demand for unique coffee options like specialty coffee, cold brew, plant-based alternatives, and personalized beverages. According to the National Coffee Association, as of July 2025, 46% of American adults reported drinking specialty coffee in the past day, showing a clear shift toward premium coffee choices. To capitalize on this trend, coffee shop operators are focusing on creating welcoming spaces, offering innovative drink menus, and providing unique customer experiences.
Digital ordering and loyalty program adoption
The growing use of loyalty programs, combined with mobile ordering platforms, is changing how customers engage with coffee brands and make purchasing decisions in the foodservice coffee market. Businesses are leveraging these digital tools to offer tailored experiences, encourage repeat visits, and build stronger connections with their customers. These platforms also enable companies to gather real-time data on consumer preferences, helping them predict demand, manage inventory efficiently, and run targeted marketing campaigns. For example, Starbucks reported nearly 34 million active rewards members in its fiscal Q3 2025 update, showcasing how loyalty programs are significantly influencing coffee consumption patterns. As consumers continue to prioritize convenience and personalized experiences, digital tools like these are becoming essential for coffee operators to remain competitive and drive market growth.
Volatility in green coffee bean prices is increasing operational costs
The foodservice coffee market is facing a major challenge due to fluctuating green coffee bean prices, which are driving up procurement costs and putting pressure on the profitability of coffee operators. Coffee production is highly sensitive to factors such as unfavorable weather conditions, supply chain disruptions, geopolitical tensions, and shifts in global trade policies. These factors collectively contribute to the instability of coffee prices. Smaller cafes and independent coffee shops are particularly affected, as they lack the purchasing power and financial tools, like hedging, that larger chains often use to manage such risks. According to the International Coffee Organization, arabica coffee stocks for the 2024/25 period have dropped to 20-21 million bags, marking the lowest levels in over 20 years. This decline in supply is further intensifying price volatility. As a result, coffee operators are struggling to strike a balance between adjusting menu prices to cover costs and keeping their offerings affordable for consumers.
Other drivers and restraints analyzed in the detailed report include:
- Growth of remote working and flexible workspaces
- Expansion of drive-thru and grab-and-go formats is improving convenience
- Growing competition from at-home coffee solutions
For complete list of drivers and restraints, kindly check the Table Of Contents.
Segment Analysis
In 2025, chained outlets were the largest contributors to the global foodservice coffee market, accounting for 62.83% of total market revenue. Their success comes from their widespread presence, efficient supply chains, and ability to keep costs under control. These outlets provide consistent quality and service, helping them build strong customer loyalty across locations. Their use of digital tools, such as online ordering systems and loyalty programs, has made it easier for customers to engage with their brand, encouraging repeat visits and strengthening their market position.
Independent outlets are projected to grow at a 7.51% CAGR through 2031, making them the fastest-growing segment of the market. This growth is driven by rising demand for specialty coffee, innovative brewing methods, and unique cafe experiences that set them apart from chain outlets. Independent cafes are often more flexible in meeting local preferences and adapting to new trends, which appeals to younger, trend-focused consumers. The rising interest in premium coffee and the personalized charm of neighborhood cafes are key drivers of this segment's growth.
Complete Report Scope:
- By Outlet Type
- Chained
- Independent
- By Service Format
- Dine-In
- Takeaway
- Delivery
- By End Use
- Coffee Shops and Cafes
- Quick-Service Restaurants (QSRs)
- Full-Service Restaurants (FSRs)
- Hotels and Resorts
- Others
- By Geography
- North America
- United States
- Canada
- Mexico
- Rest of North America
- Europe
- Germany
- United Kingdom
- Italy
- France
- Spain
- Poland
- Belgium
- Sweden
- Rest of Europe
- Asia-Pacific
- China
- Japan
- India
- Australia
- Indonesia
- South Korea
- Thailand
- Singapore
- Rest of Asia-Pacific
- South America
- Brazil
- Argentina
- Colombia
- Chile
- Peru
- Rest of South America
- Middle East and Africa
- South Africa
- Saudi Arabia
- United Arab Emirates
- Nigeria
- Egypt
- Morocco
- Turkey
- Rest of Middle East and Africa
- North America
Geography Analysis
In 2025, Europe accounted for 38.47% of the global foodservice coffee market, making it the largest regional market by value. This dominance is due to the region's strong coffee traditions, a wide network of cafes, and high per-person coffee consumption. Countries like Germany, the United Kingdom, France, and Italy are major contributors, with consistent demand for both independent and chain coffee outlets. The growing preference for premium, specialty, and sustainably sourced coffee is further driving market growth in Europe.
The Asia-Pacific region is expected to grow the fastest in the foodservice coffee market, with a 8.04% CAGR from 2026 to 2031. Rapid urbanization, higher disposable incomes, and exposure to global coffee trends are boosting coffee consumption in countries such as China, India, Indonesia, and Vietnam. Younger consumers are increasingly visiting cafes for social experiences and premium coffee options. The expansion of international coffee chains and the emergence of local brands are further accelerating the market's growth in this region.
North America, South America, the Middle East, and Africa are becoming important regions for growth and innovation in the foodservice coffee market. North America remains highly competitive, with global chains, drive-thru formats, and convenience-focused outlets introducing new products and using digital platforms to attract customers. South America benefits from its coffee-producing heritage and a growing cafe culture. Meanwhile, the Middle East and Africa are seeing rising coffee consumption due to urbanization, the growth of specialty coffee concepts, and investments in modern foodservice infrastructure. These regions are creating new opportunities and diversifying the global market landscape.
- Nestle S.A.
- JDE Peet's N.V.
- Costa Coffee (The Coca-Cola Company)
- Dunkin' (Inspire Brands)
- The J.M. Smucker Company
- Keurig Dr Pepper Inc.
- Luigi Lavazza S.p.A.
- Massimo Zanetti Beverage Group S.p.A.
- Illycaffe S.p.A.
- Tim Hortons Inc. (Restaurant Brands International Inc.)
- Starbucks Corporation
- Melitta Group
- Caffe Nero Group PLC
- Caribou Coffee Company, Inc. (JAB Holdings)
- Farmer Brothers Co.
- Tchibo GmbH
- Strauss Coffee B.V.
- Aramark Corporation
- Sysco Corporation
- Wawa, Inc.
Additional Benefits:
- The market estimate (ME) sheet in Excel format
- 3 months of analyst support
TABLE OF CONTENTS
1 INTRODUCTION
- 1.1 Study Assumptions and Market Definition
- 1.2 Scope of the Study
2 RESEARCH METHODOLOGY
3 EXECUTIVE SUMMARY
4 MARKET LANDSCAPE
- 4.1 Market Overview
- 4.2 Market Drivers
- 4.2.1 Rising cafe culture and social coffee consumption
- 4.2.2 Digital ordering and loyalty program adoption
- 4.2.3 Growth of remote working and flexible workspaces
- 4.2.4 Expansion of drive-thru and grab-and-go formats is improving convenience
- 4.2.5 Corporate and institutional coffee services are creating additional consumption opportunities
- 4.2.6 Growing tourism and hospitality activities are supporting coffee consumption
- 4.3 Market Restraints
- 4.3.1 Volatility in green coffee bean prices is increasing operational costs
- 4.3.2 Growing competition from at-home coffee solutions
- 4.3.3 Changing consumer preferences toward alternative beverages
- 4.3.4 Dependence on imported coffee beans exposes operators to currency fluctuations
- 4.4 Supply Chain Analysis
- 4.5 Regulatory Outlook
- 4.6 Porter's Five Forces
- 4.6.1 Threat of New Entrants
- 4.6.2 Bargaining Power of Buyers
- 4.6.3 Bargaining Power of Suppliers
- 4.6.4 Threat of Substitute Products
- 4.6.5 Intensity of Competitive Rivalry
5 MARKET SIZE AND GROWTH FORECASTS (VALUE)
- 5.1 By Outlet Type
- 5.1.1 Chained
- 5.1.2 Independent
- 5.2 By Service Format
- 5.2.1 Dine-In
- 5.2.2 Takeaway
- 5.2.3 Delivery
- 5.3 By End Use
- 5.3.1 Coffee Shops and Cafes
- 5.3.2 Quick-Service Restaurants (QSRs)
- 5.3.3 Full-Service Restaurants (FSRs)
- 5.3.4 Hotels and Resorts
- 5.3.5 Others
- 5.4 By Geography
- 5.4.1 North America
- 5.4.1.1 United States
- 5.4.1.2 Canada
- 5.4.1.3 Mexico
- 5.4.1.4 Rest of North America
- 5.4.2 Europe
- 5.4.2.1 Germany
- 5.4.2.2 United Kingdom
- 5.4.2.3 Italy
- 5.4.2.4 France
- 5.4.2.5 Spain
- 5.4.2.6 Poland
- 5.4.2.7 Belgium
- 5.4.2.8 Sweden
- 5.4.2.9 Rest of Europe
- 5.4.3 Asia-Pacific
- 5.4.3.1 China
- 5.4.3.2 Japan
- 5.4.3.3 India
- 5.4.3.4 Australia
- 5.4.3.5 Indonesia
- 5.4.3.6 South Korea
- 5.4.3.7 Thailand
- 5.4.3.8 Singapore
- 5.4.3.9 Rest of Asia-Pacific
- 5.4.4 South America
- 5.4.4.1 Brazil
- 5.4.4.2 Argentina
- 5.4.4.3 Colombia
- 5.4.4.4 Chile
- 5.4.4.5 Peru
- 5.4.4.6 Rest of South America
- 5.4.5 Middle East and Africa
- 5.4.5.1 South Africa
- 5.4.5.2 Saudi Arabia
- 5.4.5.3 United Arab Emirates
- 5.4.5.4 Nigeria
- 5.4.5.5 Egypt
- 5.4.5.6 Morocco
- 5.4.5.7 Turkey
- 5.4.5.8 Rest of Middle East and Africa
- 5.4.1 North America
6 COMPETITIVE LANDSCAPE
- 6.1 Market Concentration
- 6.2 Strategic Moves
- 6.3 Market Share Analysis
- 6.4 Company Profiles (includes Global-level Overview, Market-level Overview, Core Segments, Financials (if available), Strategic Information, Market Rank/Share, Products and Services, Recent Developments)
- 6.4.1 Nestle S.A.
- 6.4.2 JDE Peet's N.V.
- 6.4.3 Costa Coffee (The Coca-Cola Company)
- 6.4.4 Dunkin' (Inspire Brands)
- 6.4.5 The J.M. Smucker Company
- 6.4.6 Keurig Dr Pepper Inc.
- 6.4.7 Luigi Lavazza S.p.A.
- 6.4.8 Massimo Zanetti Beverage Group S.p.A.
- 6.4.9 Illycaffe S.p.A.
- 6.4.10 Tim Hortons Inc. (Restaurant Brands International Inc.)
- 6.4.11 Starbucks Corporation
- 6.4.12 Melitta Group
- 6.4.13 Caffe Nero Group PLC
- 6.4.14 Caribou Coffee Company, Inc. (JAB Holdings)
- 6.4.15 Farmer Brothers Co.
- 6.4.16 Tchibo GmbH
- 6.4.17 Strauss Coffee B.V.
- 6.4.18 Aramark Corporation
- 6.4.19 Sysco Corporation
- 6.4.20 Wawa, Inc.
7 MARKET OPPORTUNITIES AND FUTURE OUTLOOK

