PUBLISHER: Mordor Intelligence | PRODUCT CODE: 2073248

PUBLISHER: Mordor Intelligence | PRODUCT CODE: 2073248
United States Green Logistics - Market Share Analysis, Industry Trends & Statistics, Growth Forecasts (2026 - 2031)
According to Mordor Intelligence, the united states green logistics market size was valued at USD 359.55 billion in 2025 and estimated to grow from USD 383.41 billion in 2026 to reach USD 520.91 billion by 2031, at a CAGR of 6.32% during the forecast period (2026-2031).
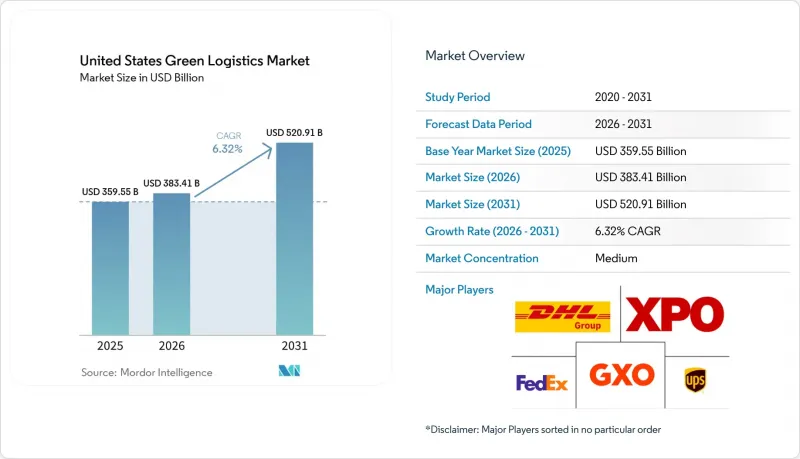
Growth in the United States green logistics market is being supported by large shippers that now treat transport decarbonization as a purchasing requirement, not only a reporting exercise, which is changing carrier selection and contract design across freight networks. This report is Segmented by Logistics Function (Green Transportation, Green Warehousing, Value-Added Services), by Fuel/Energy Type (Electric-Powered Logistics, Biofuel-Based Logistics, and More), by End-User Industry (Retail and E-Commerce, Manufacturing & Industrial, and More), and by Region (Northeast, Southeast, Midwest, Southwest, West). The Market Forecasts are Provided in Terms of Value (USD).
United States Green Logistics Market Trends and Insights
Rising Shipper Decarbonization Procurement
Corporate buying teams are no longer treating low-emission transport as an optional service layer. That change is altering how freight lanes are awarded in the United States green logistics market. Procurement-led network redesign now carries a direct emissions target, which is why carrier scorecards increasingly ask for verified transport emissions data and credible reduction pathways. RMI documented that procurement-led supply chain redesign can yield 30% to 60% reductions in Scope 3 transportation when built into carrier selection and network planning. That shift is already visible in large-scale buying models, including the January 2026 Green Market Activation trucking procurement, which brought Amazon, eBay, and Meta together to support Nevoya's 40-truck all-electric Houston-to-Dallas corridor. The practical effect is that larger carriers with digital reporting tools are winning better access to premium contracts, while smaller fleets risk being pushed out of high-value routing guides. This is one of the clearest reasons the United States green logistics market is moving beyond equipment replacement and toward service differentiation based on measurable emissions performance.
EPA And State Zero-Emission Compliance Pressure
Compliance pressure in the United States green logistics market is coming from two policy directions at the same time, forcing fleets to plan more carefully by route and state. In 2026, the EPA proposed delaying Biden-era vehicle standards, saying they could save USD 1.7 billion in compliance costs, which would normally soften transition pressure at the federal level. Yet state-level electrification rules remain firm, especially in California and other ACT coalition states, and continue to shape vehicle purchasing decisions for carriers that cross multiple regions. The policy split creates a real operational divide between fleets that can localize compliance by geography and those that need a single, broader national standard across their asset base. In practice, carriers serving ports, dense retail corridors, and regulated urban markets still have to size investments to the strictest rulebook rather than the loosest one. That reality continues to support the United States green logistics market even when the federal direction looks less certain.
High Upfront Cost Of Fleet And Facility Transition
The largest brake on the United States green logistics market remains the cost of replacing diesel fleets and upgrading sites to support new powertrains. A 2025 Nature Communications study found that battery-electric heavy-duty vehicles had 46% higher private costs in 2025 at USD 0.71 per mile compared with diesel, with the gap narrowing to 33% by 2035 as battery economics improve. That cost burden is heavier for smaller carriers because they lack the same bargaining power, financing options, or route density as large integrated networks. The result is a two-speed transition, where larger fleets can spread capital costs across more lanes while smaller operators postpone investment and remain tied to existing diesel assets. Penske's 2026 market brief still pointed to multi-powertrain resilience rather than a single straight path to full electrification, which shows how operators are managing cost risk in real time. Until financing structures, incentives, and residual value assumptions improve further, adoption across the United States green logistics market will remain uneven.
Other drivers and restraints analyzed in the detailed report include:
- EV Charging And Corridor Infrastructure Buildout
- AI-Based Routing And Load Consolidation Gains
- Grid Capacity And Interoperability Bottlenecks
For complete list of drivers and restraints, kindly check the Table Of Contents.
Segment Analysis
Green transportation led this segment, accounting for 56.11% of the United States green logistics market share in 2025, making it the largest functional block. Road transport remains the main sub-mode within that category, because fleet electrification is spreading first through last-mile, regional distribution, and other shorter-route applications where asset scheduling is easier to control. The segment also benefits from the fact that transport is the most visible source of freight emissions for shippers, so it is often the first area targeted by procurement teams and compliance programs. Rail still plays a meaningful role, especially when customers want a lower-emission option that does not require immediate truck replacement.
The fastest-growing function is green value-added services and others, which is projected to rise at a 10.91% CAGR through 2031 and reflects how sustainability is becoming a sellable service within the United States green logistics industry. Demand in this segment is being driven by emissions measurement, reverse logistics, support for sustainable packaging, and auditable insetting products that can be attached to physical freight movements. This part of the United States green logistics market is growing faster because shippers increasingly want proof, documentation, and reporting discipline alongside transport capacity, not after the shipment is complete.
Complete Report Scope:
- By Logistics Function
- Green Transportation
- Road
- Air
- Sea and Inland Waterways
- Rail
- Green Warehousing & Distribution
- Green Value-added Services and Others
- Green Transportation
- By Fuel / Energy Type
- Electric-Powered Logistics
- Biofuel-Based Logistics
- Hydrogen-Powered Logistics
- Others
- By End-user Industry
- Retail & E-commerce
- Manufacturing & Industrial
- Automotive
- Healthcare & Pharmaceuticals
- Food & Beverages
- Chemicals & Hazardous Materials
- Others
- By Region
- Northeast
- Southeast
- Midwest
- Southwest
- West
List of Companies Covered in this Report:
- United Parcel Service (UPS)
- FedEx
- DHL Group
- XPO, Inc.
- GXO Logistics, Inc.
- J.B. Hunt Transport Services, Inc.
- Schneider National, Inc.
- Ryder System, Inc.
- C.H. Robinson Worldwide, Inc.
- Amazon Freight
- Lineage Logistics, LLC
- Penske Logistics
- Kuehne+Nagel
- DSV (including DB Schenker)
- Maersk
- GEODIS
- CEVA Logistics (CMA CGM)
- Hub Group, Inc.
- ArcBest Corporation
- Old Dominion Freight Line, Inc.
- Knight-Swift Transportation Holdings Inc.
- Werner Enterprises, Inc.
Additional Benefits:
- The market estimate (ME) sheet in Excel format
- 3 months of analyst support
TABLE OF CONTENTS
1 Introduction
- 1.1 Study Assumptions & Market Definition
- 1.2 Scope of the Study
2 Research Methodology
3 Executive Summary
4 Market Landscape
- 4.1 Market Overview and Role of Green Logistics in Logistics
- 4.2 ESG Spending Trends
- 4.3 Market Drivers
- 4.3.1 Rising Shipper Decarbonization Procurement
- 4.3.2 EPA and State Zero-Emission Compliance Pressure
- 4.3.3 EV Charging and Corridor Infrastructure Buildout
- 4.3.4 AI-Based Routing and Load Consolidation Gains
- 4.3.5 Electrified Port and Warehouse Equipment Adoption
- 4.3.6 Emissions Reporting and Auditability Demand
- 4.4 Market Restraints
- 4.4.1 High Upfront Cost of Fleet and Facility Transition
- 4.4.2 Grid Capacity and Interoperability Bottlenecks
- 4.4.3 Residual Diesel Asset Lock-In and Depreciation Risk
- 4.4.4 Shortage of Skilled Green Logistics Operators
- 4.5 Regulatory Framework
- 4.6 Value Chain and Distribution Channel Architecture Analysis
- 4.7 Technology Innovations Outlook
- 4.8 Porter's Five Forces
- 4.8.1 Threat of New Entrants
- 4.8.2 Bargaining Power of Suppliers
- 4.8.3 Bargaining Power of Buyers
- 4.8.4 Threat of Substitutes
- 4.8.5 Rivalry Among Competitors
- 4.9 Evolution of Green Logistics Requirements
- 4.10 Impact of Geo-Political Events on Supply Chain Shifts
5 Market Size & Growth Forecasts (Value, 2026-2031)
- 5.1 By Logistics Function
- 5.1.1 Green Transportation
- 5.1.1.1 Road
- 5.1.1.2 Air
- 5.1.1.3 Sea and Inland Waterways
- 5.1.1.4 Rail
- 5.1.2 Green Warehousing & Distribution
- 5.1.3 Green Value-added Services and Others
- 5.1.1 Green Transportation
- 5.2 By Fuel / Energy Type
- 5.2.1 Electric-Powered Logistics
- 5.2.2 Biofuel-Based Logistics
- 5.2.3 Hydrogen-Powered Logistics
- 5.2.4 Others
- 5.3 By End-user Industry
- 5.3.1 Retail & E-commerce
- 5.3.2 Manufacturing & Industrial
- 5.3.3 Automotive
- 5.3.4 Healthcare & Pharmaceuticals
- 5.3.5 Food & Beverages
- 5.3.6 Chemicals & Hazardous Materials
- 5.3.7 Others
- 5.4 By Region
- 5.4.1 Northeast
- 5.4.2 Southeast
- 5.4.3 Midwest
- 5.4.4 Southwest
- 5.4.5 West
6 Competitive Landscape
- 6.1 Market Concentration
- 6.2 Key Strategic Moves
- 6.3 Market Share Analysis
- 6.4 Company Profiles (includes Global level Overview, Market level overview, Core Segments, Financials as available, Strategic Information, Market Rank/Share for key companies, Products & Services, and Recent Developments)
- 6.4.1 United Parcel Service (UPS)
- 6.4.2 FedEx
- 6.4.3 DHL Group
- 6.4.4 XPO, Inc.
- 6.4.5 GXO Logistics, Inc.
- 6.4.6 J.B. Hunt Transport Services, Inc.
- 6.4.7 Schneider National, Inc.
- 6.4.8 Ryder System, Inc.
- 6.4.9 C.H. Robinson Worldwide, Inc.
- 6.4.10 Amazon Freight
- 6.4.11 Lineage Logistics, LLC
- 6.4.12 Penske Logistics
- 6.4.13 Kuehne+Nagel
- 6.4.14 DSV (including DB Schenker)
- 6.4.15 Maersk
- 6.4.16 GEODIS
- 6.4.17 CEVA Logistics (CMA CGM)
- 6.4.18 Hub Group, Inc.
- 6.4.19 ArcBest Corporation
- 6.4.20 Old Dominion Freight Line, Inc.
- 6.4.21 Knight-Swift Transportation Holdings Inc.
- 6.4.22 Werner Enterprises, Inc.
7 Market Opportunities & Future Outlook
- 7.1 White-space & Unmet-Need Assessment

