
PUBLISHER: Mordor Intelligence | PRODUCT CODE: 2073438

PUBLISHER: Mordor Intelligence | PRODUCT CODE: 2073438
Noble Gas - Market Share Analysis, Industry Trends & Statistics, Growth Forecasts (2026 - 2031)
According to Mordor Intelligence, the noble gas market size is estimated at 6.24 billion cubic meters in 2026, and is expected to reach 7.60 billion cubic meters by 2031, at a CAGR of 4.03% during the forecast period (2026-2031).
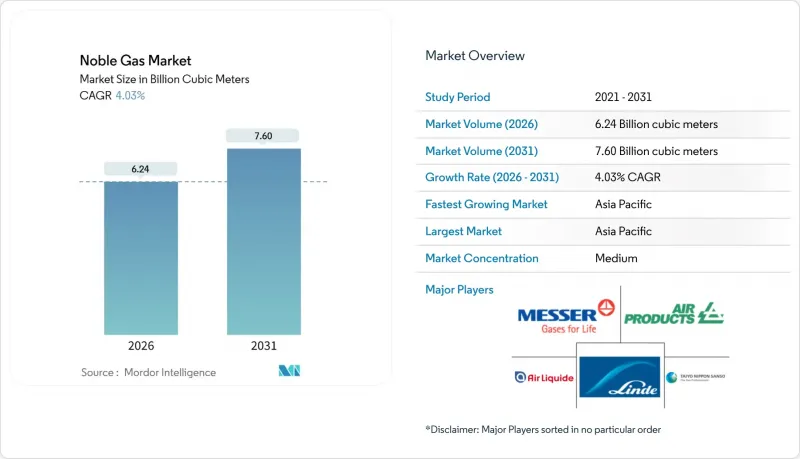
This report is Segmented by Type (Helium, Krypton, Argon, Neon, Xenon, and Radon), and Geography (Asia-Pacific, North America, Europe, South America, and Middle-East and Africa). Market Forecasts are Provided in Terms of Volume (Cubic Meters).
Global Noble Gas Market Trends and Insights
Rising Healthcare Demand for Ultra-High-Purity Helium
Global installations of MRI systems, which still rely on substantial helium volumes to maintain superconducting magnets at a chilly 4.2 Kelvin, have been growing, driven by an aging population's increasing need for imaging procedures. While Philips' BlueSeal magnet has successfully slashed helium consumption, a significant portion of the installed base still comprises legacy equipment, ensuring a meaningful helium demand persists. Hospitals in the United States and Germany, reacting to rising spot quotes, extended their replenishment contracts to longer terms, aiming for price stability. Meanwhile, Japan's portable MRI prototypes embarked on clinical trials, hinting at a potential demand shift. Yet, with cryogen-free designs still in their infancy, the healthcare sector remains a cornerstone for helium industry demand within the noble gas market.
Resurgence of Steel and Automotive Welding Activity
In 2024, China produced a high quantity of crude steel, restoring pre-pandemic throughput and accelerating argon uptake for shielded welding. Electric-vehicle battery-pack fabrication needs argon purities above 99.996%, and Tesla's Shanghai plant alone consumed a portion of China's merchant supply. European automakers have shifted to laser-arc hybrid welding that co-uses helium to deepen weld penetration, adding to consumption across Germany, France, and Spain in 2024. Fabricators favored multi-year agreements indexed to power costs to mitigate European electricity price spikes. Robust welding dynamics therefore reinforce argon's dominant role within the noble gas market.
Helium and Neon Price Volatility
In 2024-2025, the United States' helium spot prices fluctuated due to outages at the Cliffside storage site and reduced exports from Russia. Neon prices experienced sharper spikes when Ukraine halted production. Chinese suppliers stepped in, commanding premium prices until new capacity became operational in 2025. While major semiconductor companies shielded themselves through volume-commitment contracts, smaller OEMs faced margin pressures, leading to a slowdown in capital expenditures. This heightened volatility not only dampens discretionary consumption but also increases working-capital requirements, moderating short-term growth in the noble gas market.
Other drivers and restraints analyzed in the detailed report include:
- Expansion of Semiconductor Fabs in Asia-Pacific
- Rapid Uptake of Additive-Manufacturing Shielding Atmospheres
- Energy-Intensive Cryogenic Separation Costs
For complete list of drivers and restraints, kindly check the Table Of Contents.
Segment Analysis
Argon held 56.12% of the noble gas market volume in 2025, reflecting entrenched use in metal-inert-gas and tungsten-inert-gas welding across global steel and automotive plants. China's surge in electric-vehicle output and battery-pack fabrication lifted argon demand, and India's capacity expansions under the Production-Linked Incentive scheme sustained elevated off-take through 2025. The noble gas market size attributed to argon is forecast to continue expanding in absolute terms, although its share erodes gradually as neon growth outpaces it.
Neon is projected to grow at a 7.12% CAGR through 2031, the fastest among noble gases, as extreme ultraviolet lithography triples gas consumption per wafer compared with deep ultraviolet tools. Helium demand rose modestly, constrained by North American field depletion and price swings that pushed end users toward recycling. Krypton enjoyed incremental pull from insulating-glass standards, while xenon benefited from a robust satellite launch cadence. Despite these shifts, argon remains the anchor of the noble gas market, whereas neon represents the principal growth lever driving rebalancing across the portfolio.
Complete Report Scope:
- By Type
- Helium
- Healthcare
- Electronics
- Welding Cover Gas
- Lifting Gas
- Controlled Atmospheres
- Leak Detection
- Breathing Mixtures
- Analytical Gas
- Other Applications/End-user Industries
- Krypton
- Construction (Insulating Glass)
- Lighting
- Excimer Lasers
- Other Applications/End-user Industries
- Argon
- Protective Gas for Welding
- Electronics and Semiconductor
- Lighting
- Other Applications/End-user Industries
- Neon
- Electronics (Lasers)
- Display Components
- Lighting
- Other Applications/End-user Industries
- Xenon
- Lighting
- Satellites
- Healthcare (Anesthetics)
- Electronics (Photolithiography)
- Electronics (Lasers)
- Plasma/AMOLED Screens
- Other Applications/End-user Industries
- Radon
- Helium
- By Geography
- Asia-Pacific
- China
- India
- Japan
- South Korea
- ASEAN Countries
- Rest of Asia-Pacific
- North America
- United States
- Canada
- Mexico
- Europe
- Germany
- Belgium
- United Kingdom
- Italy
- France
- Spain
- Russia
- Netherlands
- Rest of Europe
- South America
- Brazil
- Argentina
- Rest of South America
- Middle-East and Africa
- Saudi Arabia
- South Africa
- Rest of Middle-East and Africa
- Asia-Pacific
Geography Analysis
Asia-Pacific accounted for 51.12% of the noble gas market volume in 2025 and is tracking a 5.64% CAGR to 2031, bolstered by semiconductor fab build-outs, steel capacity expansions, and accelerating electric-vehicle production. In 2025, chipmakers advanced to 3 nm nodes, leading Taiwan and South Korea to increase neon consumption. Meanwhile, in 2024, India witnessed significant volume growth, thanks to new air-separation units launched by Air Liquide in Gujarat. Dominating the scene, China accounted for a substantial share of global argon consumption.
In 2025, North America maintained a steady share but is shifting from a domestic helium surplus to a reliance on imports, as traditional reservoirs in Kansas and Texas dwindle. Meanwhile, exploration companies in Alberta and Saskatchewan are racing to bridge the gap. In a significant move, Air Products has committed USD 500 million in Louisiana, focusing on helium recovery from Gulf Coast gas streams. Europe grapples with high power costs and an aging cryogenic infrastructure. These challenges limit supply flexibility, leading industry giants Linde and Messer to prioritize retrofitting existing facilities over establishing new ones. South America and the Middle East are buoyed by Brazil's steel production and Saudi Arabia's petrochemical initiatives. This localized demand is further bolstered by Gulf Cryo's expanded network across the GCC.
- Air Liquide
- Air Products and Chemicals Inc.
- Airgas Inc.
- American Gas
- BASF SE
- Buzwair Industrial Gases Factories
- First Helium
- Gulf Cryo
- ITM Power
- Iwatani Corporation.
- Linde plc
- MATHESON TRI-GAS INC.
- Messer North America, Inc.
- Praxair Technology, Inc.
- Ras Gas Company Limited
- Royal Dutch Shell PLC
- TAIYO NIPPON SANSO CORPORATION
Additional Benefits:
- The market estimate (ME) sheet in Excel format
- 3 months of analyst support
TABLE OF CONTENTS
1 Introduction
- 1.1 Study Assumptions and Market Definition
- 1.2 Scope of the Study
2 Research Methodology
3 Executive Summary
4 Market Landscape
- 4.1 Market Overview
- 4.2 Market Drivers
- 4.2.1 Rising healthcare demand for ultra-high-purity helium
- 4.2.2 Resurgence of steel and automotive welding activity
- 4.2.3 Expansion of semiconductor fabs in Asia-Pacific
- 4.2.4 Rapid uptake of additive-manufacturing shielding atmospheres
- 4.2.5 Exploration of low-carbon, primary-helium fields in Africa and Canada
- 4.3 Market Restraints
- 4.3.1 Helium and neon price volatility
- 4.3.2 Energy-intensive cryogenic separation costs
- 4.3.3 Tightening export controls on critical gases
- 4.4 Value Chain Analysis
- 4.5 Porter's Five Forces
- 4.5.1 Bargaining Power of Suppliers
- 4.5.2 Bargaining Power of Consumers
- 4.5.3 Threat of New Entrants
- 4.5.4 Threat of Substitute Products and Services
- 4.5.5 Degree of Competition
5 Market Size and Growth Forecasts (Volume)
- 5.1 By Type
- 5.1.1 Helium
- 5.1.1.1 Healthcare
- 5.1.1.2 Electronics
- 5.1.1.3 Welding Cover Gas
- 5.1.1.4 Lifting Gas
- 5.1.1.5 Controlled Atmospheres
- 5.1.1.6 Leak Detection
- 5.1.1.7 Breathing Mixtures
- 5.1.1.8 Analytical Gas
- 5.1.1.9 Other Applications/End-user Industries
- 5.1.2 Krypton
- 5.1.2.1 Construction (Insulating Glass)
- 5.1.2.2 Lighting
- 5.1.2.3 Excimer Lasers
- 5.1.2.4 Other Applications/End-user Industries
- 5.1.3 Argon
- 5.1.3.1 Protective Gas for Welding
- 5.1.3.2 Electronics and Semiconductor
- 5.1.3.3 Lighting
- 5.1.3.4 Other Applications/End-user Industries
- 5.1.4 Neon
- 5.1.4.1 Electronics (Lasers)
- 5.1.4.2 Display Components
- 5.1.4.3 Lighting
- 5.1.4.4 Other Applications/End-user Industries
- 5.1.5 Xenon
- 5.1.5.1 Lighting
- 5.1.5.2 Satellites
- 5.1.5.3 Healthcare (Anesthetics)
- 5.1.5.4 Electronics (Photolithiography)
- 5.1.5.5 Electronics (Lasers)
- 5.1.5.6 Plasma/AMOLED Screens
- 5.1.5.7 Other Applications/End-user Industries
- 5.1.6 Radon
- 5.1.1 Helium
- 5.2 By Geography
- 5.2.1 Asia-Pacific
- 5.2.1.1 China
- 5.2.1.2 India
- 5.2.1.3 Japan
- 5.2.1.4 South Korea
- 5.2.1.5 ASEAN Countries
- 5.2.1.6 Rest of Asia-Pacific
- 5.2.2 North America
- 5.2.2.1 United States
- 5.2.2.2 Canada
- 5.2.2.3 Mexico
- 5.2.3 Europe
- 5.2.3.1 Germany
- 5.2.3.2 Belgium
- 5.2.3.3 United Kingdom
- 5.2.3.4 Italy
- 5.2.3.5 France
- 5.2.3.6 Spain
- 5.2.3.7 Russia
- 5.2.3.8 Netherlands
- 5.2.3.9 Rest of Europe
- 5.2.4 South America
- 5.2.4.1 Brazil
- 5.2.4.2 Argentina
- 5.2.4.3 Rest of South America
- 5.2.5 Middle-East and Africa
- 5.2.5.1 Saudi Arabia
- 5.2.5.2 South Africa
- 5.2.5.3 Rest of Middle-East and Africa
- 5.2.1 Asia-Pacific
6 Competitive Landscape
- 6.1 Market Concentration
- 6.2 Strategic Moves
- 6.3 Market Share/Ranking Analysis
- 6.4 Company Profiles (includes Global-level Overview, Market-level Overview, Core Segments, Financials, Strategic Information, Market Rank/Share, Products and Services, Recent Developments)
- 6.4.1 Air Liquide
- 6.4.2 Air Products and Chemicals Inc.
- 6.4.3 Airgas Inc.
- 6.4.4 American Gas
- 6.4.5 BASF SE
- 6.4.6 Buzwair Industrial Gases Factories
- 6.4.7 First Helium
- 6.4.8 Gulf Cryo
- 6.4.9 ITM Power
- 6.4.10 Iwatani Corporation.
- 6.4.11 Linde plc
- 6.4.12 MATHESON TRI-GAS INC.
- 6.4.13 Messer North America, Inc.
- 6.4.14 Praxair Technology, Inc.
- 6.4.15 Ras Gas Company Limited
- 6.4.16 Royal Dutch Shell PLC
- 6.4.17 TAIYO NIPPON SANSO CORPORATION
7 Market Opportunities and Future Outlook
- 7.1 White-space and Unmet-Need Assessment

