
PUBLISHER: Mordor Intelligence | PRODUCT CODE: 2073443

PUBLISHER: Mordor Intelligence | PRODUCT CODE: 2073443
Desktop Virtualization - Market Share Analysis, Industry Trends & Statistics, Growth Forecasts (2026 - 2031)
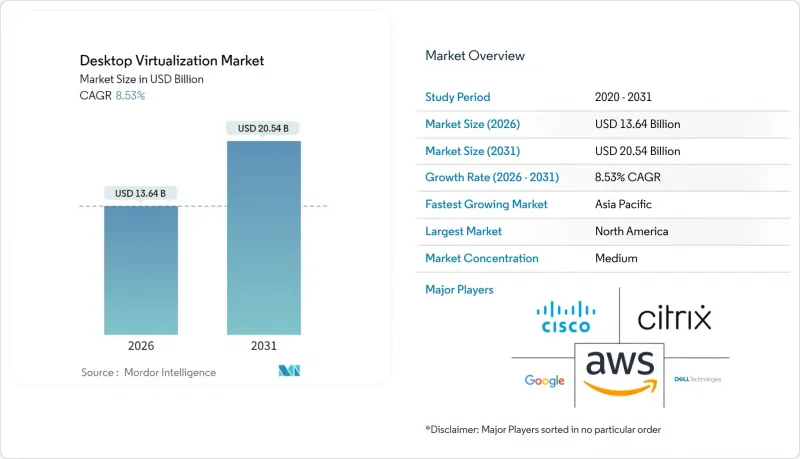
According to Mordor Intelligence, the desktop virtualization market size is estimated at USD 13.64 billion in 2026, and is expected to reach USD 20.54 billion by 2031, at a CAGR of 8.53% during the forecast period (2026-2031).
This report is Segmented by Desktop Delivery Platform (Hosted Virtual Desktop, Hosted Shared Desktop, and Desktop-As-A-Service), Deployment (On-Premises, and Cloud), End-User Vertical (Financial Services, Healthcare, Retail and E-Commerce, and More), Organization Size (Small and Medium Enterprises (SMEs), and Large Enterprises), and Geography. The Market Forecasts are Provided in Terms of Value (USD).
Global Desktop Virtualization Market Trends and Insights
Surge in Bring-Your-Own-Device Policies
Organizations have embedded BYOD programs to reduce hardware outlay and support hybrid work, yet unmanaged endpoints expose corporate assets to malware and data exfiltration. NIST Special Publication 800-46 Rev. 3 urged federal agencies to conduct device-posture checks before launching VDI sessions, a recommendation private-sector chief information security officers adopted to satisfy cyber-insurance requirements. By streaming only pixel data to personal devices, desktop virtualization creates an air gap between sensitive workloads and consumer operating systems. JPMorgan Chase delivered VDI to 60,000 traders in 2025, enabling algorithmic models to remain within data-center enclaves while employees worked from home networks. As zero-trust frameworks mature, conditional-access policies that verify device health and user identity before session launch are accelerating desktop virtualization market adoption.
Rapid Adoption of Cloud-Hosted Desktops and DaaS
Cloud-native VDI displaces on-premises builds because IT teams no longer forecast peak capacity years ahead, a practice that created stranded hardware or performance bottlenecks. Azure Virtual Desktop and AWS WorkSpaces introduced autoscaling in 2025, spinning up additional compute within 90 seconds once average session density crosses 80%. Enterprises such as Siemens consolidated 200 regional VDI clusters into three Azure regions, eliminating data-center leases and saving EUR 18 million (USD 19.44 million) annually. Multi-cloud deployment is now a hedge against vendor lock-in, with one-third of enterprises running desktops across two or more hyperscalers to meet data-sovereignty rules.
High Upfront Cost of On-Premises VDI Infrastructure
Building an in-house VDI stack demands hypervisor licenses, shared storage arrays, and GPU-ready servers that can exceed USD 2,500 per user before networking upgrades. Enterprises must provision N+1 redundancy to preserve service during hardware failures, effectively doubling server spend. Hyper-converged alternatives reduce complexity yet still require capital that smaller firms struggle to amortize over refresh cycles. Consequently, many SMEs favor Desktop-as-a-Service subscriptions that bundle infrastructure, patching, and support into monthly fees, shifting the cost curve and drawing spend away from on-premises equipment.
Other drivers and restraints analyzed in the detailed report include:
- Need for Centralized Security and Compliance
- Cost Savings from GPU Virtualization for CAD/CAE Users
- Network Latency and Bandwidth Constraints
For complete list of drivers and restraints, kindly check the Table Of Contents.
Segment Analysis
Hosted Virtual Desktop retained 45.92% of 2025 market revenue, yet the desktop virtualization market size for Desktop-as-a-Service is projected to grow at an annual rate of 11.52% to 2031. Cloud-provisioned desktops eliminate the need for hypervisor management while enabling administrators to enforce identical security baselines on every session. Microsoft integrated Azure Virtual Desktop with Intune in 2025, allowing policy inheritance between physical and virtual endpoints. Seasonal sectors, such as retail, scale seat counts by 300% during holidays, a use case that hosted shared servers cannot match. At the same time, low-latency demands in equities trading still justify the use of private VDI clusters located near exchange engines. Citrix reported 68% of on-premises customers operated in regulated niches, illustrating that hybrid coexistence will persist well into the forecast horizon. Emerging container delivery models, notably VMware Horizon Cloud Next-Gen, blur boundaries further by streaming Docker-packed Windows apps through HTML5 browsers.
Hosted Shared Desktop finds niche growth in academic labs and call centers where standardized workloads prevail. Desktop-as-a-Service (DaaS) removes administrator restrictions that plagued shared servers, allowing contractors to install project-specific plugins without jeopardizing neighboring sessions. GPU-fractionalization now lets cloud-hosted desktops serve designers with 4 GB slices reserved only during rendering, shrinking idle overspend. Vendors market vertical bundles, such as financial DaaS packages that embed Bloomberg terminals and audit logging, commanding 20% premiums over generic seats. Consequently, the desktop virtualization market continues to diversify delivery formats rather than converging on a single architecture.
Cloud held 60.44% of market value in 2025, and its desktop virtualization market share will deepen as hyperscalers achieve 70-80% CPU utilization. Ten-minute workstation provisioning is eclipsing the three-day lead time for on-premises builds. AWS launched a USD 195 WorkSpaces Thin Client in 2025 that boots directly into a cloud session and removes Windows license costs on edge devices. Data gravity keeps seismic modeling and genomic workloads on-premises, but even these sectors experiment with hybrid setups that reserve cloud desktops for contractors. Hyper-converged appliances reduce operational drag by bundling compute, storage, and networking into scale-out nodes, trimming five-year ownership costs by 28% compared with traditional SANs.
Europe's GDPR localization clause steers many enterprises toward private clouds hosted inside regional borders, sustaining on-premises investment despite global migration patterns. Nutanix AHV 7.0 added dynamic GPU assignment, consolidating workloads and postponing hardware refreshes. For edge factories requiring sub-10 ms round-trip to shop-floor robots, local nodes remain indispensable. However, AWS, Azure, and Google Cloud are deploying metro-edge zones that bring core services within city limits, undermining latency arguments for private clusters. Over the forecast horizon, most organizations will run persistent desktops on-premises for executives while bursting cloud seats for contingent staff, illustrating a pragmatic rather than ideological deployment split.
Complete Report Scope:
- By Desktop Delivery Platform
- Hosted Virtual Desktop (HVD)
- Hosted Shared Desktop (HSD)
- Desktop-as-a-Service (DaaS)/Other Forms
- By Deployment
- On-Premises
- Cloud
- By End-User Vertical
- Financial Services
- Healthcare
- Retail and E-commerce
- Manufacturing
- IT and Telecom
- Government and Public Sector
- Education
- Other End-Use Verticals
- By Organization Size
- Small and Medium Enterprises (SMEs)
- Large Enterprises
- By Geography
- North America
- United States
- Canada
- Mexico
- South America
- Brazil
- Argentina
- Rest of South America
- Europe
- Germany
- United Kingdom
- France
- Italy
- Spain
- Rest of Europe
- Asia-Pacific
- China
- Japan
- India
- South Korea
- ASEAN
- Rest of Asia-Pacific
- Middle East
- Saudi Arabia
- United Arab Emirates
- Rest of Middle East
- Africa
- South Africa
- Nigeria
- Rest of Africa
- North America
Geography Analysis
North America led 2025 revenue at 37.21% due to early hybrid-work mandates and substantial cloud budgets. Growth is now moderating as deployments shift from greenfield to license renewals and capacity tweaks. Regional vendors differentiate through FedRAMP High and StateRAMP certifications that unlock public-sector contracts.
Asia Pacific is projected to post a 13.26% CAGR, the fastest worldwide. China's Data Security Law compels in-country data storage, pushing multinationals to deploy local VDI clusters rather than route sessions through foreign regions. India's Digital India funding is expanding fiber networks and hyperscale data centers, prerequisites for mass rollouts in education and municipal health clinics. Edge nodes from carriers such as China Mobile cut round-trip latency below 20 ms, enabling GPU-intensive editing suites to run in the cloud without perceptible lag.
Europe remains a steady adopter. GDPR localization rules encourage private or sovereign clouds; 62% of enterprises operated VDI inside member-state borders in 2025, according to CISPE. Middle East governments invest in national-cloud infrastructure, with Saudi Arabia's Public Investment Fund allocating USD 6.4 billion for data centers to host government desktops. South America and Africa remain nascent because broadband costs and taxation schemes inflate total cost of ownership, but 5G fixed-wireless pilots in Brazil and Kenya signal a potential inflection by 2028. For multinationals, the desktop virtualization market is fragmenting into regional silos governed by data-residency laws rather than a single global deployment footprint.
- Amazon Web Services, Inc.
- Citrix Systems, Inc.
- Cisco Systems, Inc.
- Dell Technologies Inc.
- Google LLC
- Fujitsu Limited
- Hewlett-Packard Inc.
- Huawei Technologies Co., Ltd.
- IGEL Technology GmbH
- Leostream Corporation
- Microsoft Corporation
- NEC Corporation
- Nutanix, Inc.
- NComputing Co., Ltd.
- Oracle Corporation
- Parallels International GmbH
- Red Hat, Inc.
- Sangfor Technologies Inc.
- Scale Computing, Inc.
- Stratodesk Corporation
- Tencent Cloud Computing (Beijing) Co., Ltd.
- Omnissa LLC
- VMware, Inc.
Additional Benefits:
- The market estimate (ME) sheet in Excel format
- 3 months of analyst support
TABLE OF CONTENTS
1 INTRODUCTION
- 1.1 Study Assumptions and Market Definition
- 1.2 Scope of the Study
2 RESEARCH METHODOLOGY
3 EXECUTIVE SUMMARY
4 MARKET LANDSCAPE
- 4.1 Market Overview
- 4.2 Market Drivers
- 4.2.1 Surge in Bring-Your-Own-Device (BYOD) Policies
- 4.2.2 Rapid Adoption of Cloud-hosted Desktops and DaaS
- 4.2.3 Need for Centralized Security and Compliance
- 4.2.4 Cost Savings from GPU Virtualization for CAD/CAE Users
- 4.2.5 Edge-computing-enabled Low-latency VDI Roll-outs
- 4.2.6 Data-residency Regulations Spurring in-country VDI
- 4.3 Market Restraints
- 4.3.1 High Upfront Cost of On-premises VDI Infrastructure
- 4.3.2 Network Latency and Bandwidth Constraints
- 4.3.3 Complex Multi-session OS Licensing Models
- 4.3.4 Limited GPU Passthrough on ARM-based Endpoints
- 4.4 Industry Value Chain Analysis
- 4.5 Regulatory Landscape
- 4.6 Technological Outlook
- 4.7 Porter's Five Forces Analysis
- 4.7.1 Bargaining Power of Suppliers
- 4.7.2 Bargaining Power of Buyers
- 4.7.3 Threat of New Entrants
- 4.7.4 Threat of Substitutes
- 4.7.5 Intensity of Competitive Rivalry
5 MARKET SIZE AND GROWTH FORECASTS (VALUE)
- 5.1 By Desktop Delivery Platform
- 5.1.1 Hosted Virtual Desktop (HVD)
- 5.1.2 Hosted Shared Desktop (HSD)
- 5.1.3 Desktop-as-a-Service (DaaS)/Other Forms
- 5.2 By Deployment
- 5.2.1 On-Premises
- 5.2.2 Cloud
- 5.3 By End-User Vertical
- 5.3.1 Financial Services
- 5.3.2 Healthcare
- 5.3.3 Retail and E-commerce
- 5.3.4 Manufacturing
- 5.3.5 IT and Telecom
- 5.3.6 Government and Public Sector
- 5.3.7 Education
- 5.3.8 Other End-Use Verticals
- 5.4 By Organization Size
- 5.4.1 Small and Medium Enterprises (SMEs)
- 5.4.2 Large Enterprises
- 5.5 By Geography
- 5.5.1 North America
- 5.5.1.1 United States
- 5.5.1.2 Canada
- 5.5.1.3 Mexico
- 5.5.2 South America
- 5.5.2.1 Brazil
- 5.5.2.2 Argentina
- 5.5.2.3 Rest of South America
- 5.5.3 Europe
- 5.5.3.1 Germany
- 5.5.3.2 United Kingdom
- 5.5.3.3 France
- 5.5.3.4 Italy
- 5.5.3.5 Spain
- 5.5.3.6 Rest of Europe
- 5.5.4 Asia-Pacific
- 5.5.4.1 China
- 5.5.4.2 Japan
- 5.5.4.3 India
- 5.5.4.4 South Korea
- 5.5.4.5 ASEAN
- 5.5.4.6 Rest of Asia-Pacific
- 5.5.5 Middle East
- 5.5.5.1 Saudi Arabia
- 5.5.5.2 United Arab Emirates
- 5.5.5.3 Rest of Middle East
- 5.5.6 Africa
- 5.5.6.1 South Africa
- 5.5.6.2 Nigeria
- 5.5.6.3 Rest of Africa
- 5.5.1 North America
6 COMPETITIVE LANDSCAPE
- 6.1 Market Concentration
- 6.2 Strategic Moves
- 6.3 Market Share Analysis
- 6.4 Company Profiles (includes Global level Overview, Market Level Overview, Core Segments, Financials as Available, Strategic Information, Market Rank/Share for Key Companies, Products and Services, and Recent Developments)
- 6.4.1 Amazon Web Services, Inc.
- 6.4.2 Citrix Systems, Inc.
- 6.4.3 Cisco Systems, Inc.
- 6.4.4 Dell Technologies Inc.
- 6.4.5 Google LLC
- 6.4.6 Fujitsu Limited
- 6.4.7 Hewlett-Packard Inc.
- 6.4.8 Huawei Technologies Co., Ltd.
- 6.4.9 IGEL Technology GmbH
- 6.4.10 Leostream Corporation
- 6.4.11 Microsoft Corporation
- 6.4.12 NEC Corporation
- 6.4.13 Nutanix, Inc.
- 6.4.14 NComputing Co., Ltd.
- 6.4.15 Oracle Corporation
- 6.4.16 Parallels International GmbH
- 6.4.17 Red Hat, Inc.
- 6.4.18 Sangfor Technologies Inc.
- 6.4.19 Scale Computing, Inc.
- 6.4.20 Stratodesk Corporation
- 6.4.21 Tencent Cloud Computing (Beijing) Co., Ltd.
- 6.4.22 Omnissa LLC
- 6.4.23 VMware, Inc.
7 MARKET OPPORTUNITIES AND FUTURE OUTLOOK
- 7.1 White-space and Unmet-Need Assessment

