
PUBLISHER: Mordor Intelligence | PRODUCT CODE: 2073623

PUBLISHER: Mordor Intelligence | PRODUCT CODE: 2073623
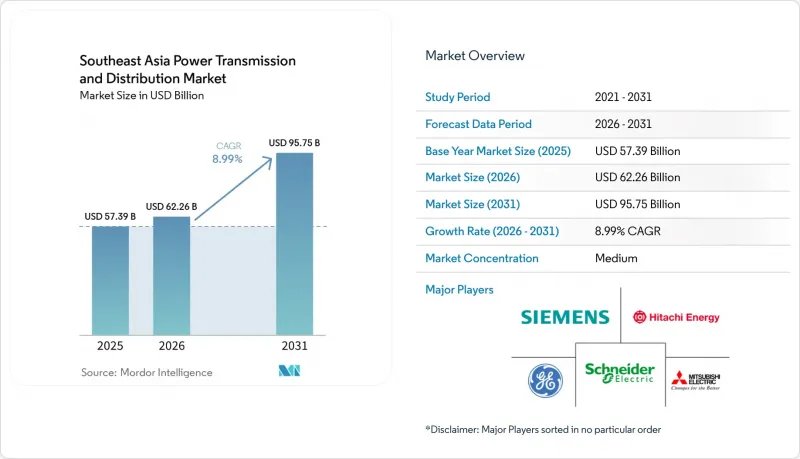
Southeast Asia Power Transmission and Distribution - Market Share Analysis, Industry Trends & Statistics, Growth Forecasts (2026 - 2031)
According to Mordor Intelligence, the southeast asia power transmission and Distribution Market size is projected to expand from USD 57.39 billion in 2025 and USD 62.26 billion in 2026 to USD 95.75 billion by 2031, registering a CAGR of 8.99% between 2026 to 2031.
This report is Segmented by Equipment Type (Transformers, Switchgear, Power Cables, Transmission Towers, Voltage Regulators, and More), Voltage Level (High, Extra-High, and More), Installation Type (New Build/Greenfield and Upgrade and Replacement), End-User (Power Utilities, Industrial, Commercial, and Residential), and Geography (Vietnam, Indonesia, Philippines, and More).
Southeast Asia Power Transmission and Distribution Market Trends and Insights
Surging Electricity Demand from Cooling & EV Uptake
Air-conditioning penetration is nearing 70% of households in Thailand and Malaysia, and the resulting afternoon-to-night peak forces distribution utilities to oversize transformers and deploy switched capacitor banks to maintain power factor. Parallel growth in electric-vehicle registrations, 120,000 in Thailand alone during 2025, adds localized step-load spikes that require 22 kV dedicated feeders to protect residential circuits. Time-of-use tariffs and advanced metering infrastructure are therefore gaining traction, accelerating procurement of communication-enabled transformers that can support real-time load shedding. Utilities are also testing AI-driven demand forecasts linking weather data with social-media sentiment to predict heat-wave spikes, which calls for fiber backbones and edge-computing nodes at substations. The combined load profile is reshaping the Southeast Asia power transmission and distribution market by prioritizing dynamic reactive compensation and fast-acting voltage regulators.
Government Renewable-Integration Mandates
Vietnam's Power Development Plan VIII allocates 30.9 GW of offshore wind by 2030, while Indonesia plans to retire 9.2 GW of coal and backfill with solar and geothermal, intensifying the need for long-distance 500 kV routes that wheel power from resource belts to load centers. EVN's 1,500 km north-south line in Vietnam now channels 5 GW of southern wind toward Hanoi and Haiphong, triggering procurement of shunt reactors and static VAR compensators to stabilize voltage swings. Grid-code revisions also require utilities to maintain +-5% voltage under 40% renewable penetration, amplifying demand for fast-response switchgear. Mandates, therefore, underpin the long-term growth narrative of the Southeast Asia power transmission and distribution market and enlarge the addressable pool for grid-firming equipment.
High CAPEX & Utility Budget Constraints
A 500 kV circuit-kilometer costs USD 1.2-1.8 million, while tariff caps limit average utility revenue growth to 4-6%, squeezing free cash flow and slowing project pipelines. Indonesia's PLN reported a USD 2.1 billion funding gap in 2025, deferring 12 substations to 2027 and prioritizing lower-voltage distribution projects with faster social payback. The Philippines capped allowable returns for its grid concessionaire at 12%, extending debt-raising timelines for the Mindanao-Visayas link by nine months. Although multilateral lenders shoulder a portion of capex, concessional finance covers only 30-40% of needs, obliging utilities to allocate scarce funds to politically visible rural electrification rather than backbone reinforcement, dampening near-term growth in the Southeast Asia power transmission and distribution market.
Other drivers and restraints analyzed in the detailed report include:
- Smart-Grid Digitalization Programs
- ASEAN Power Grid Interconnector Build-Out
- Regulatory / Land-Acquisition Delays
For complete list of drivers and restraints, kindly check the Table Of Contents.
Segment Analysis
Power cables secured 34.3% of 2025 revenue, making them the largest line item within the Southeast Asia power transmission and distribution market size. Subway-scale urbanization in Jakarta, Manila, and Bangkok encourages undergrounding to free road corridors and avoid visual clutter. Medium-voltage XLPE designs below 35 kV constitute 60% of total cable kilometers laid, while HVDC export cables serve offshore wind pathways and cross-border links. Transformers are split between power classes above 72.5 kV and distribution classes below; Indonesia alone procured 18,000 distribution units in 2025 to extend electrification. GIS switchgear commands urban and offshore sites despite a 40% cost premium because it cuts footprint by 70% compared with air-insulated alternatives.
The "other equipment" cluster, voltage regulators, capacitors, shunt reactors, and insulators will grow at a 10.8% CAGR to 2031, the highest within the Southeast Asia power transmission and distribution market. Utilities require dynamic reactive compensation as renewable penetration rises toward 40% in Thailand and Vietnam. Shunt reactors mitigate capacitive charging on 500 kV trunks; EVN registered +-150 MVAR swings on light-load nights, prompting accelerated procurement. Polymer insulators now displace porcelain in coastal zones owing to salt-spray corrosion, a policy Malaysia codified in 2025. Rising steel prices linked to the EU Carbon Border Adjustment Mechanism pressured tower manufacturers to pursue composite alternatives, highlighting cost volatility across the supply chain.
Assets between 35 kV and 220 kV delivered 46.1% of 2025 revenue and remain the workhorse backbone, interlinking regional grids and stepping bulk power to distribution. Thailand's 115 kV mesh supports load transfers during maintenance and limits solar curtailment. Distribution utilities in Vietnam and Indonesia migrate from 11 kV to 22 kV feeders, cutting copper consumption 35% per kilometer and improving loss performance.
Ultra-high-voltage routes above 800 kV are poised for an 11.1% CAGR, driven by Laos' hydropower exports and potential links to China's southern grid. Trial +-800 kV UHVDC corridors show 3.5% losses over 2,000 km, making them attractive for remote wind integration. Extra-high-voltage (220-765 kV) remains dominant for national grids; Indonesia operates 9,200 circuit-km of 500 kV and plans 3,500 km more by 2030. GIS at 500 kV slices substation land use 40%, a decisive advantage in land-scarce Singapore, thereby steering procurement toward compact designs in the Southeast Asia power transmission and distribution market.
Complete Report Scope:
- By Equipment Type
- Transformers
- Power Transformers (Above 72.5 kV)
- Distribution Transformers (Up to 72.5 kV)
- Switchgear
- Gas-Insulated Switchgear (GIS)
- Air-Insulated Switchgear (AIS)
- Other Switchgears
- Power Cables
- Transmission Cables
- Distribution Cables
- Transmission Towers
- Towers
- Poles
- Voltage Regulators
- Insulators
- Capacitors
- Shunt Reactors
- Other Equipment Type
- Transformers
- By Voltage Level
- Low Voltage (Up to 1 kV)
- Medium Voltage (1 to 35 kV)
- High Voltage (35 to 220 kV)
- Extra-High Voltage (220 to 765 kV)
- Ultra-High Voltage (Above 800 kV)
- By Installation Type
- New Build/Greenfield
- Upgrade and Replacement
- By End-User
- Power Utilities (Transmission System Operators, Distribution Utilities, Renewable Plant Owners and IPPs)
- Industrial (Oil and Gas, Metals and Mining, Petrochemicals)
- Commercial (includes Data-Centers)
- Residential
- By Geography
- Vietnam
- Indonesia
- Philippines
- Thailand
- Malaysia
- Singapore
- Rest of Southeast Asia
List of Companies Covered in this Report:
- Siemens AG
- Hitachi Energy
- Schneider Electric SE
- Mitsubishi Electric Corp.
- General Electric Co.
- Toshiba Corp.
- ABB Ltd.
- LS Electric
- Hyosung Heavy Industries
- CG Power & Industrial Solutions
- PT PLN (Persero)
- Vietnam Electricity (EVN)
- Tenaga Nasional Berhad (TNB)
- National Grid Corporation of the Philippines
- SP Group (Singapore Power)
- Sarawak Energy Berhad
- KEPCO KPS
- Romelectro Group
- Nexans SA
- Prysmian Group
- Trenergy Infrastructure
- Siemens Gamesa Grid Solutions
Additional Benefits:
- The market estimate (ME) sheet in Excel format
- 3 months of analyst support
TABLE OF CONTENTS
1 Introduction
- 1.1 Study Assumptions & Market Definition
- 1.2 Scope of the Study
2 Research Methodology
3 Executive Summary
4 Market Landscape
- 4.1 Market Overview
- 4.2 Market Drivers
- 4.2.1 Surging electricity demand from cooling & EV uptake
- 4.2.2 Government renewable-integration mandates
- 4.2.3 Smart-grid digitalisation programs
- 4.2.4 ASEAN Power Grid interconnector build-out
- 4.2.5 Data-centre capacity boom
- 4.2.6 Climate-resilient grid design standards
- 4.3 Market Restraints
- 4.3.1 High CAPEX & utility budget constraints
- 4.3.2 Regulatory/land-acquisition delays
- 4.3.3 Inflexible coal PPAs limiting grid flexibility
- 4.3.4 Carbon-pricing-driven rise in low-carbon steel costs
- 4.4 Supply-Chain Analysis
- 4.5 Regulatory Landscape
- 4.6 Technological Outlook
- 4.7 Porter's Five Forces
- 4.7.1 Bargaining Power of Suppliers
- 4.7.2 Bargaining Power of Consumers
- 4.7.3 Threat of New Entrants
- 4.7.4 Threat of Substitute Products & Services
- 4.7.5 Intensity of Competitive Rivalry
5 Market Size & Growth Forecasts
- 5.1 By Equipment Type
- 5.1.1 Transformers
- 5.1.1.1 Power Transformers (Above 72.5 kV)
- 5.1.1.2 Distribution Transformers (Up to 72.5 kV)
- 5.1.2 Switchgear
- 5.1.2.1 Gas-Insulated Switchgear (GIS)
- 5.1.2.2 Air-Insulated Switchgear (AIS)
- 5.1.2.3 Other Switchgears
- 5.1.3 Power Cables
- 5.1.3.1 Transmission Cables
- 5.1.3.2 Distribution Cables
- 5.1.4 Transmission Towers
- 5.1.4.1 Towers
- 5.1.4.2 Poles
- 5.1.5 Voltage Regulators
- 5.1.6 Insulators
- 5.1.7 Capacitors
- 5.1.8 Shunt Reactors
- 5.1.9 Other Equipment Type
- 5.1.1 Transformers
- 5.2 By Voltage Level
- 5.2.1 Low Voltage (Up to 1 kV)
- 5.2.2 Medium Voltage (1 to 35 kV)
- 5.2.3 High Voltage (35 to 220 kV)
- 5.2.4 Extra-High Voltage (220 to 765 kV)
- 5.2.5 Ultra-High Voltage (Above 800 kV)
- 5.3 By Installation Type
- 5.3.1 New Build/Greenfield
- 5.3.2 Upgrade and Replacement
- 5.4 By End-User
- 5.4.1 Power Utilities (Transmission System Operators, Distribution Utilities, Renewable Plant Owners and IPPs)
- 5.4.2 Industrial (Oil and Gas, Metals and Mining, Petrochemicals)
- 5.4.3 Commercial (includes Data-Centers)
- 5.4.4 Residential
- 5.5 By Geography
- 5.5.1 Vietnam
- 5.5.2 Indonesia
- 5.5.3 Philippines
- 5.5.4 Thailand
- 5.5.5 Malaysia
- 5.5.6 Singapore
- 5.5.7 Rest of Southeast Asia
6 Competitive Landscape
- 6.1 Market Concentration
- 6.2 Strategic Moves (M&A, Partnerships, PPAs)
- 6.3 Market Share Analysis (Market Rank/Share for key companies)
- 6.4 Company Profiles (includes Global level Overview, Market level overview, Core Segments, Financials as available, Strategic Information, Products & Services, and Recent Developments)
- 6.4.1 Siemens AG
- 6.4.2 Hitachi Energy
- 6.4.3 Schneider Electric SE
- 6.4.4 Mitsubishi Electric Corp.
- 6.4.5 General Electric Co.
- 6.4.6 Toshiba Corp.
- 6.4.7 ABB Ltd.
- 6.4.8 LS Electric
- 6.4.9 Hyosung Heavy Industries
- 6.4.10 CG Power & Industrial Solutions
- 6.4.11 PT PLN (Persero)
- 6.4.12 Vietnam Electricity (EVN)
- 6.4.13 Tenaga Nasional Berhad (TNB)
- 6.4.14 National Grid Corporation of the Philippines
- 6.4.15 SP Group (Singapore Power)
- 6.4.16 Sarawak Energy Berhad
- 6.4.17 KEPCO KPS
- 6.4.18 Romelectro Group
- 6.4.19 Nexans SA
- 6.4.20 Prysmian Group
- 6.4.21 Trenergy Infrastructure
- 6.4.22 Siemens Gamesa Grid Solutions
7 Market Opportunities & Future Outlook
- 7.1 White-space & Unmet-Need Assessment

