
PUBLISHER: Mordor Intelligence | PRODUCT CODE: 2097220

PUBLISHER: Mordor Intelligence | PRODUCT CODE: 2097220
Stainless Steel - Market Share Analysis, Industry Trends & Statistics, Growth Forecasts (2025 - 2031)
According to Mordor Intelligence, the stainless steel market size is projected to expand from 13.37 million tons in 2025 and 14 million tons in 2026 to 17.63 million tons by 2031, registering a CAGR of 4.72% between 2026 to 2031.
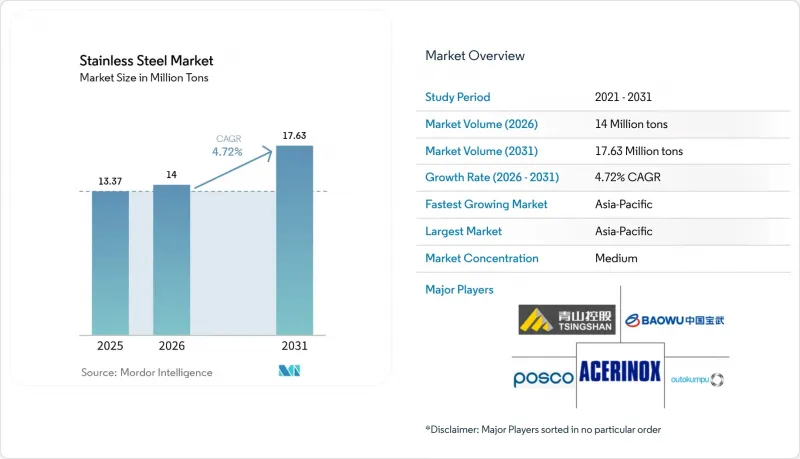
This report is Segmented by Product Type (Flat Products, and Long Products), Form (Hot Rolled, Cold Rolled, and Cold Drawn), Grade (200 Series, 300 Series, and More), Application (Building and Construction, Automotive and Transportation, Metal Products, and More), and Geography (Asia-Pacific, North America, Europe, Sand More). The Market Forecasts are Provided in Terms of Volume (Tons).
Global Stainless Steel Market Trends and Insights
Mandatory Use of Stainless-Steel Rebar in India's Coastal Codes
India's 2024 circular mandating stainless rebar within 30 km of coastlines under IS 16651:2017 enforces a 75-year design life, cutting lifecycle costs by 40% versus epoxy-coated carbon steel. Early adoption in Mumbai, Chennai, and Kochi metro rail projects alone represents a USD 600 million captive pool over five years, while domestic producers Shyam Metalics, AISCO, and Synergy Steels still trail demand. Imports from Indonesia and Vietnam are filling the gap despite a 5% basic customs duty, underscoring supply-side tightness. Insurers are already pricing corrosion risk into coastal property premiums, raising private-sector interest. As regulatory compliance becomes a default project requirement, the stainless steel market gains an anchor demand stream insulated from construction cycles.
LNG and Cryogenic Storage Build-Out Across Asia
Asia's shift from coal to natural gas is spawning a wave of LNG terminals, each large tank using up to 3,000 tons of 304, 316L, or 321 stainless steel. China's 14th Five-Year Plan targets 100 million t/y of LNG import capacity, while India approved five new terminals in 2024 that add 10 million t/y of regasification. Membrane-type containment systems, favored for thin-gauge stainless sheets, amplify volume intensity. Indonesia and Malaysia are fielding floating storage and regasification units to serve archipelagic grids, spreading procurement across multiple fabricators. Because LNG infrastructure is classified as strategic, project timelines and offtake contracts cushion demand from macroeconomic swings, securing a medium-term floor for the stainless steel market.
Nickel-Price Volatility Prompting Appliance OEM Substitution
In 2024, the London Metal Exchange reported an average nickel price. By mid-2025, prices dipped, only to bounce back in March 2025. This fluctuation unsettled mill margins. While the World Bank forecasts a price in 2026, the ongoing volatility is steering OEMs towards 200-series or aluminum liners for washing machines and refrigerators. Data indicates that in 2024, stainless steel accounted for a significant portion of primary nickel consumption. However, it is anticipated that by 2030, cleantech will capture a notable share of this consumption, tightening the supply. A surge in nickel prices translates to a reduction in mill EBITDA. This, in turn, prompts price increases downstream, affecting volume in the more price-sensitive segments of the stainless steel market.
Other drivers and restraints analyzed in the detailed report include:
- Replacement of Food-Processing Equipment Under U.S. FSMA
- Green-Hydrogen Electrolyzer Adoption in EU Boosting Demand for Duplex Grade
- EU Anti-Dumping Tariffs on Chinese Imports
For complete list of drivers and restraints, kindly check the Table Of Contents.
Segment Analysis
Flat products commanded a 67.20% stainless steel market share in 2025 and are tracking a 5.14% CAGR through 2031. The global market for flat products is projected to grow, driven by the preference for coil, sheet, and plate in construction facades, automotive body panels, and appliance casings. Tata Steel's Odisha line, inaugurated in 2024, is honing in on the thin-gauge cold-rolled coil, which commands a premium over its hot-rolled counterpart. As architectural trends shift towards lighter curtain-wall systems, there's a surging demand for 1.2 mm sheets, prompting mills to invest in advanced annealing and pickling lines.
While long products dominated market volume in 2025, they maintain strongholds in reinforcing bars, wire rods, and marine fasteners. Thanks to India's coastal rebar mandate, a structural demand is anticipated to grow annually by 2027. Even with aluminum wire vying for a stake in electrical cabling, the duplex-grade bar continues to dominate niches in offshore drilling and desalination. In summary, the stainless steel market is witnessing a clear bifurcation: flat products are buoyed by infrastructure and consumer goods, whereas long products cater to specialized, high-performance needs.
Cold-rolled material held 54.11% stainless steel market share in 2025 and is expanding at a 5.11% CAGR. Cold rolling produces +-0.05 mm tolerances, and mirror finishes are essential for visible kitchen, elevator, and vehicle panels. The FDA's sanitary design rules institutionalize cold-rolled 304/316L in food-contact surfaces, making replacements non-discretionary every decade. Mills with inline bright-anneal capacity capture higher price realization, typically USD 150-200/t over standard annealed material.
Hot-rolled stainless steel meets structural requirements in bridges and water pipelines financed under India's USD 1.4 trillion infrastructure plan. It sacrifices finish for cost and high thickness availability. Cold-drawn wire caters to medical sutures and aerospace bolts where +-0.01 mm diameter accuracy commands a USD 500/ton premium. The tri-layered form landscape allows mills to calibrate product mix in response to margin swings.
Complete Report Scope:
- By Product Type
- Flat Products (Coil, Sheets, Plates)
- Long Products (Bars, rods and wire)
- By Form
- Hot Rolled
- Cold Rolled
- Cold Drawn
- By Grade
- 200 Series
- 300 Series
- 400 Series
- Duplex
- Precipitation-Hardening and Others
- By Application
- Building and Construction
- Automotive and Transportation
- Metal Products
- Electrical Machinery
- Mechanical Engineering
- Other Applications
- By Geography
- Asia-Pacific
- China
- India
- Japan
- South Korea
- Malaysia
- Thailand
- Indonesia
- Vietnam
- Rest of Asia-Pacific
- North America
- United States
- Canada
- Mexico
- Europe
- Germany
- United Kingdom
- France
- Italy
- Spain
- Nordics
- Turkey
- Russia
- Rest of Europe
- South America
- Brazil
- Argentina
- Colombia
- Rest of South America
- Middle-East and Africa
- Saudi Arabia
- Qatar
- United Arab Emirates
- Turkey
- South Africa
- Nigeria
- Egypt
- Rest of Middle-East and Africa
- Asia-Pacific
Geography Analysis
Asia-Pacific controlled 61.29% of the 2025 volume and is accelerating at 5.34%, cementing its role as the stainless steel market epicenter. China, a leading producer in the region, faces moderating domestic uptake as property starts to decline; mills pivot exports toward tariff-light regions such as Southeast Asia and Africa. India's pipeline, valued at USD 1.4 trillion, channels stainless into metro rail, desalination, and coastal bridges, with Jindal Stainless now able to supply 2.1 million ton/year from its enlarged Jajpur site. Indonesia's Tsingshan leverages captive nickel, driving costs 15-20% below global averages and flooding ASEAN with competitively priced coil.
North America's stainless steel market demand is lifted by the U.S. Infrastructure Act's USD 1.2 trillion allocation and FDA-driven sanitary retrofits that add 20,000 tons/year demand. Mexico's 3.5 million vehicle output benefits from USMCA incentives, sustaining exhaust-system stainless uptake. Europe navigates anti-dumping tariffs that elevate domestic prices but stimulate investments in duplex electrolyzer components under REPowerEU targets.
South America and the Middle East-Africa are witnessing a rising demand driven by oil-and-gas pipelines in Brazil's pre-salt fields and desalination plants in the Gulf. Regional diversification of supply blunts tariff exposure and creates multi-polar stainless steel market trade routes.
- Acciai Speciali Terni S.p.A.
- Acerinox
- Aperam
- ArcelorMittal
- ATI
- BengangGroup
- China BaoWu Steel Group Corporation Limited
- Dongkuk Steel Mill Co., Ltd.
- HYUNDAI STEEL
- JFE Steel Corporation
- Jindal Stainless Limited
- NIPPON STEEL CORPORATION
- Nisshin Metal Services(M) SDN.BHD.
- Outokumpu
- POSCO
- Sandvik AB
- ShanXi TaiGang Stainless Steel Co.,Ltd.
- Tata Steel
- TSINGSHAN HOLDING GROUP
- Valbruna S.p.a.
- Yieh Corp.
Additional Benefits:
- The market estimate (ME) sheet in Excel format
- 3 months of analyst support
TABLE OF CONTENTS
1 Introduction
- 1.1 Study Assumptions and Market Definition
- 1.2 Scope of the Study
2 Research Methodology
3 Executive Summary
4 Market Landscape
- 4.1 Market Overview
- 4.2 Market Drivers
- 4.2.1 Mandatory use of stainless-steel rebar in India's coastal codes
- 4.2.2 LNG and cryogenic storage build-out across Asia
- 4.2.3 Replacement of food-processing equipment under U.S. FSMA
- 4.2.4 Green-hydrogen electrolyzer adoption in EU boosting demand for duplex grade
- 4.2.5 Growing demand from construction industry
- 4.3 Market Restraints
- 4.3.1 Nickel-price volatility prompting appliance OEM substitution
- 4.3.2 EU anti-dumping tariffs on Chinese imports
- 4.3.3 Availability of substitutes (aluminum, engineered plastics)
- 4.4 Value Chain Analysis
- 4.5 Porter's Five Forces
- 4.5.1 Bargaining Power of Suppliers
- 4.5.2 Bargaining Power of Buyers
- 4.5.3 Threat of New Entrants
- 4.5.4 Threat of Substitutes
- 4.5.5 Degree of Competition
5 Market Size and Growth Forecasts (Volume)
- 5.1 By Product Type
- 5.1.1 Flat Products (Coil, Sheets, Plates)
- 5.1.2 Long Products (Bars, rods and wire)
- 5.2 By Form
- 5.2.1 Hot Rolled
- 5.2.2 Cold Rolled
- 5.2.3 Cold Drawn
- 5.3 By Grade
- 5.3.1 200 Series
- 5.3.2 300 Series
- 5.3.3 400 Series
- 5.3.4 Duplex
- 5.3.5 Precipitation-Hardening and Others
- 5.4 By Application
- 5.4.1 Building and Construction
- 5.4.2 Automotive and Transportation
- 5.4.3 Metal Products
- 5.4.4 Electrical Machinery
- 5.4.5 Mechanical Engineering
- 5.4.6 Other Applications
- 5.5 By Geography
- 5.5.1 Asia-Pacific
- 5.5.1.1 China
- 5.5.1.2 India
- 5.5.1.3 Japan
- 5.5.1.4 South Korea
- 5.5.1.5 Malaysia
- 5.5.1.6 Thailand
- 5.5.1.7 Indonesia
- 5.5.1.8 Vietnam
- 5.5.1.9 Rest of Asia-Pacific
- 5.5.2 North America
- 5.5.2.1 United States
- 5.5.2.2 Canada
- 5.5.2.3 Mexico
- 5.5.3 Europe
- 5.5.3.1 Germany
- 5.5.3.2 United Kingdom
- 5.5.3.3 France
- 5.5.3.4 Italy
- 5.5.3.5 Spain
- 5.5.3.6 Nordics
- 5.5.3.7 Turkey
- 5.5.3.8 Russia
- 5.5.3.9 Rest of Europe
- 5.5.4 South America
- 5.5.4.1 Brazil
- 5.5.4.2 Argentina
- 5.5.4.3 Colombia
- 5.5.4.4 Rest of South America
- 5.5.5 Middle-East and Africa
- 5.5.5.1 Saudi Arabia
- 5.5.5.2 Qatar
- 5.5.5.3 United Arab Emirates
- 5.5.5.4 Turkey
- 5.5.5.5 South Africa
- 5.5.5.6 Nigeria
- 5.5.5.7 Egypt
- 5.5.5.8 Rest of Middle-East and Africa
- 5.5.1 Asia-Pacific
6 Competitive Landscape
- 6.1 Market Concentration
- 6.2 Strategic Moves
- 6.3 Market Share(%)/Ranking Analysis
- 6.4 Company Profiles (includes Global-level Overview, Market-level Overview, Core Segments, Financials as available, Strategic Information, Market Rank/Share, Products and Services, Recent Developments)
- 6.4.1 Acciai Speciali Terni S.p.A.
- 6.4.2 Acerinox
- 6.4.3 Aperam
- 6.4.4 ArcelorMittal
- 6.4.5 ATI
- 6.4.6 BengangGroup
- 6.4.7 China BaoWu Steel Group Corporation Limited
- 6.4.8 Dongkuk Steel Mill Co., Ltd.
- 6.4.9 HYUNDAI STEEL
- 6.4.10 JFE Steel Corporation
- 6.4.11 Jindal Stainless Limited
- 6.4.12 NIPPON STEEL CORPORATION
- 6.4.13 Nisshin Metal Services(M) SDN.BHD.
- 6.4.14 Outokumpu
- 6.4.15 POSCO
- 6.4.16 Sandvik AB
- 6.4.17 ShanXi TaiGang Stainless Steel Co.,Ltd.
- 6.4.18 Tata Steel
- 6.4.19 TSINGSHAN HOLDING GROUP
- 6.4.20 Valbruna S.p.a.
- 6.4.21 Yieh Corp.
7 Market Opportunities and Future Outlook
- 7.1 White-space and Unmet-Need Assessment
- 7.2 Growing innovation in sustainable manufacturing process

