PUBLISHER: Mordor Intelligence | PRODUCT CODE: 2099882

PUBLISHER: Mordor Intelligence | PRODUCT CODE: 2099882
Transactional Video-on-Demand (TVOD) - Market Share Analysis, Industry Trends & Statistics, Growth Forecasts (2026 - 2031)
According to Mordor Intelligence, the transactional video-on-demand market size was valued at USD 43.18 billion in 2025 and is estimated to grow from USD 46.21 billion in 2026 to reach USD 62.30 billion by 2031, at a CAGR of 6.16% during the forecast period (2026-2031).
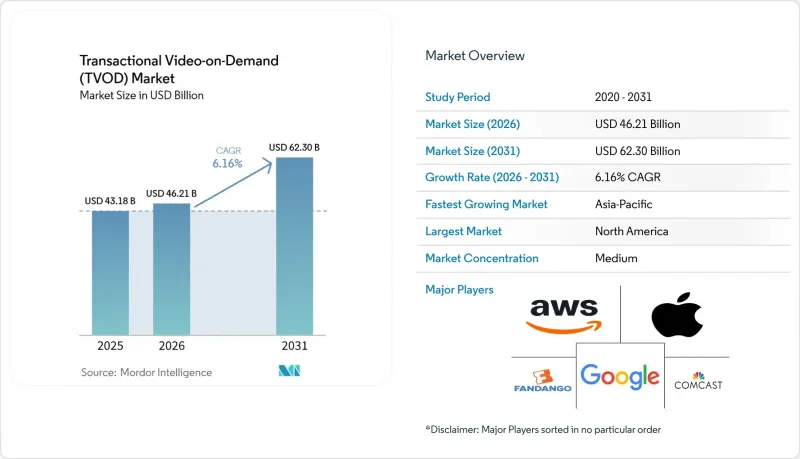
This report is Segmented by Content Type (Movies and Films, TV Shows, Documentaries, and Other Content Types), Revenue Model (Rental/DTR, Purchase/EST, Pay-Per-View, and Other Revenue Models), Device Type (Smartphones and Tablets, Smart TVs, Laptops and Desktops, and Other Devices), and Geography. The Market Forecasts are Provided in Terms of Value (USD).
Global Transactional Video-on-Demand (TVOD) Market Trends and Insights
Rising Consumer Willingness to Pay for New-Release Access
Consumer willingness to pay is strongest when a title still carries theatrical buzz, and the release feels current rather than archival. Premium rentals work because viewers often treat a major film launch as a one-off rather than a routine catalog choice. That supports a pricing lane in the transactional video-on-demand market that sits well above standard library rentals during periods of concentrated demand around the first digital window. The model is especially effective for households that want immediate access but do not want to wait for a later subscription release. It also favors platforms that make checkout fast and reduce the number of steps between discovery and payment. As a result, the transactional video-on-demand market continues to hold a monetization position that subscription bundles do not fully absorb.
Expansion of Premium Windowing Across Studios and Territories
Premium windowing moved from a temporary release response into a more deliberate studio strategy during 2025 and 2026. Several major studios maintained meaningful gaps between theatrical release and TVOD availability, and many top films remained unavailable on home transaction channels for at least 45 days. Disney also maintained longer theatrical-to-digital release windows for major releases, with some titles extending well beyond 2 months and one reaching 102 days before TVOD availability. Paramount publicly committed to a minimum 45-day theatrical window, which signaled that longer premium timing had support beyond a single studio. This helps the transactional video-on-demand market because the delayed home debut often concentrates demand into a more intense opening digital period. Instead of diluting interest, a longer wait can raise the value of the first paid access moment.
Subscription Bundling and Ad-Supported Alternatives Eroding Transactional Demand
Subscription bundles and ad-supported services continue to pressure catalog-based transactions by reducing the need for one-off purchases of older titles. Ad-supported tiers accounted for the majority of gross subscriber additions across premium SVOD platforms in early 2025, indicating that low-cost entry points were attracting a large share of new users. Free and low-cost streaming choices are especially disruptive when the title is widely available and no longer tied to a premium release window. This weakens repeat rental behavior for library films and series, particularly in mature markets where households already carry multiple streaming services. The transactional video-on-demand market is most exposed when it tries to compete on broad catalog access rather than on urgency, exclusivity, or live viewing. That is why platforms are leaning more heavily into new-release movies and event pay-per-view, where ad-supported substitutes are less direct.
Other drivers and restraints analyzed in the detailed report include:
- Growth of Hybrid OTT Ecosystems That Bundle Rental and Purchase Flows
- Smart TV and Connected Device Penetration
- Price Sensitivity for Repeat Viewers Limiting Purchase Frequency
For complete list of drivers and restraints, kindly check the Table Of Contents.
Segment Analysis
Movies and Films accounted for 58.32% share of the transactional video-on-demand market size in 2025. This lead stems from the theatrical-to-transactional release pattern, which still makes new-release films the main driver of paid digital demand. Franchise blockbusters, awards-season titles, and family releases create scarcity that supports per-transaction pricing before subscription availability begins. Documentaries remained a smaller but distinct category, with viewers willing to pay for premium investigative and nature titles ahead of broader streaming access. The Other content types segment included sports events, music performances, and early interactive formats, giving the transactional video-on-demand industry a path beyond a film-only catalog mix.
TV Shows and Episodic Content are projected to expand at a 6.72% CAGR through 2031, making it the fastest-growing content segment. Growth is being supported by premium access to high-demand season launches, K-drama titles, and anime series, where rights are often fragmented by region. Zee Entertainment's Z5 platform doubled its weekly active users to 27 million within 2 weeks of the FIFA World Cup 2026, with transactional packages starting at INR 799 (USD 9.56) for 3 months. Amazon's combined Prime Video and MX Player platform in India also uses TVOD as the early-access layer for high-demand titles before they move into subscription circulation. This keeps the transactional video-on-demand market relevant even as episodic viewing becomes more tied to hybrid platform design.
Complete Report Scope:
- By Content Type
- Movies and Films
- TV Shows and Episodic Content
- Documentaries
- Other Content Types
- By Revenue Model
- Rental / DTR (Download to Rent)
- Purchase / EST (Electronic Sell-Through)
- Pay-Per-View
- Other Revenue Models
- By Device Type
- Smartphones and Tablets
- Smart TVs
- Laptops and Desktops
- Other Devices
- By Geography
- North America
- United States
- Canada
- Mexico
- South America
- Brazil
- Argentina
- Chile
- Rest of South America
- Europe
- Germany
- United Kingdom
- France
- Italy
- Spain
- Rest of Europe
- Asia-Pacific
- China
- Japan
- India
- South Korea
- Australia
- Rest of Asia-Pacific
- Middle East
- Saudi Arabia
- United Arab Emirates
- Qatar
- Rest of Middle East
- Africa
- South Africa
- Egypt
- Nigeria
- Rest of Africa
- North America
Geography Analysis
North America held 41.87% of the transactional video-on-demand market share in 2025. The United States remained the main pricing and volume benchmark, with Amazon Prime Video, Apple TV, and Google TV shaping common rental and purchase behavior across the category. Canada followed a similar pattern because release timing, storefront access, and consumer habits closely align with those of the US market. Mexico continued to expand its paid audience as hybrid payment models, such as OXXO cash vouchers and SPEI transfers, helped support transactions beyond the traditional credit card base. In South America, Brazil's VOD platform count rose from 60 in 2024 to 106 in 2025, with more than 138,000 titles available across the ecosystem, indicating that platform infrastructure continued to deepen even as pricing sensitivity remained an issue.
Europe remained a split transactional landscape, with Germany and the UK standing out among the larger Western European storefronts. Germany has historically shown a stronger shift from physical ownership to digital purchase than many other European markets. France faced greater pressure from ad-supported and free streaming services, reducing the room for repeat catalog transactions. Rakuten TV responded by widening operator-led distribution, including a March 2026 partnership with Vodafone TV Spain that added around 6,000 rental titles to the operator environment. Italy's CHILI moved ahead with a relaunch built around TVOD, AVOD, and business-to-business services, while Saudi Arabia and the United Arab Emirates remained the most commercially advanced markets across the broader Middle East and Africa region.
Asia-Pacific is projected to expand at a 7.67% CAGR through 2031, making it the fastest-growing region in the transactional video-on-demand market. Japan, India, and South Korea support this expansion through premium local content, telecom bundle relationships, and strong demand for early access viewing around popular franchises and cultural exports. India's payment infrastructure is especially important because UPI made one-click transactions routine for a very large digital audience in 2025. Amazon's integration of MX Player into Prime Video in India also turned the country into a multi-model test bed for SVOD, AVOD, TVOD, and add-on subscriptions within a single service.
- Amazon.com, Inc.
- Apple Inc.
- Google LLC (Alphabet Inc.)
- Fandango Media, LLC
- Comcast Corporation
- Roku, Inc.
- Sony Group Corporation
- Rakuten Group, Inc.
- Lionsgate Plc
- Orange S.A.
- America Movil, S.A.B. de C.V.
- Fetch TV Pty Limited
- CHILI S.p.A.
- Pathe SAS
- SF Studios AB
- JioStar Media and Distribution Ltd.
- Zee Entertainment Enterprises Limited
- Preemz, LLC
- Plex, Inc.
- DIRECTV, LLC
Additional Benefits:
- The market estimate (ME) sheet in Excel format
- 3 months of analyst support
TABLE OF CONTENTS
1 INTRODUCTION
- 1.1 Study Assumptions and Market Definition
- 1.2 Scope of the Study
2 RESEARCH METHODOLOGY
3 EXECUTIVE SUMMARY
4 MARKET LANDSCAPE
- 4.1 Market Overview
- 4.2 Market Drivers
- 4.2.1 Rising Consumer Willingness to Pay for New Release Access
- 4.2.2 Expansion of Premium Windowing Across Studios and Territories
- 4.2.3 Growth of Hybrid OTT Ecosystems That Bundle Rental and Purchase Flows
- 4.2.4 Smart TV and Connected Device Penetration
- 4.2.5 Mobile Wallet and One-Click Checkout Adoption in Emerging Markets
- 4.2.6 CDN and Codec Optimization Lowering Per-Transaction Delivery Friction
- 4.3 Market Restraints
- 4.3.1 Subscription Bundling and Ad-Supported Alternatives Erode Transactional Demand
- 4.3.2 Price Sensitivity for Repeat Viewers Limits Purchase Frequency
- 4.3.3 Content Overlap Across Major Platforms Compresses Differentiation
- 4.3.4 Rights Fragmentation and Windowing Complexity Raise Operating Costs
- 4.4 Industry Value Chain Analysis
- 4.5 Regulatory Landscape
- 4.6 Technological Outlook
- 4.7 Impact of Macroeconomic Factors on the Market
- 4.8 Porter's Five Forces Analysis
- 4.8.1 Threat of New Entrants
- 4.8.2 Bargaining Power of Buyers
- 4.8.3 Bargaining Power of Suppliers
- 4.8.4 Threat of Substitutes
- 4.8.5 Intensity of Competitive Rivalry
5 MARKET SIZE AND GROWTH FORECASTS (VALUE)
- 5.1 By Content Type
- 5.1.1 Movies and Films
- 5.1.2 TV Shows and Episodic Content
- 5.1.3 Documentaries
- 5.1.4 Other Content Types
- 5.2 By Revenue Model
- 5.2.1 Rental / DTR (Download to Rent)
- 5.2.2 Purchase / EST (Electronic Sell-Through)
- 5.2.3 Pay-Per-View
- 5.2.4 Other Revenue Models
- 5.3 By Device Type
- 5.3.1 Smartphones and Tablets
- 5.3.2 Smart TVs
- 5.3.3 Laptops and Desktops
- 5.3.4 Other Devices
- 5.4 By Geography
- 5.4.1 North America
- 5.4.1.1 United States
- 5.4.1.2 Canada
- 5.4.1.3 Mexico
- 5.4.2 South America
- 5.4.2.1 Brazil
- 5.4.2.2 Argentina
- 5.4.2.3 Chile
- 5.4.2.4 Rest of South America
- 5.4.3 Europe
- 5.4.3.1 Germany
- 5.4.3.2 United Kingdom
- 5.4.3.3 France
- 5.4.3.4 Italy
- 5.4.3.5 Spain
- 5.4.3.6 Rest of Europe
- 5.4.4 Asia-Pacific
- 5.4.4.1 China
- 5.4.4.2 Japan
- 5.4.4.3 India
- 5.4.4.4 South Korea
- 5.4.4.5 Australia
- 5.4.4.6 Rest of Asia-Pacific
- 5.4.5 Middle East
- 5.4.5.1 Saudi Arabia
- 5.4.5.2 United Arab Emirates
- 5.4.5.3 Qatar
- 5.4.5.4 Rest of Middle East
- 5.4.6 Africa
- 5.4.6.1 South Africa
- 5.4.6.2 Egypt
- 5.4.6.3 Nigeria
- 5.4.6.4 Rest of Africa
- 5.4.1 North America
6 COMPETITIVE LANDSCAPE
- 6.1 Market Concentration
- 6.2 Strategic Moves
- 6.3 Vendor Positioning Analysis
- 6.4 Company Profiles (includes Global Level Overview, Market Level Overview, Core Segments, Financials as available, Strategic Information, Market Rank/Share, Products and Services, Recent Developments)
- 6.4.1 Amazon.com, Inc.
- 6.4.2 Apple Inc.
- 6.4.3 Google LLC (Alphabet Inc.)
- 6.4.4 Fandango Media, LLC
- 6.4.5 Comcast Corporation
- 6.4.6 Roku, Inc.
- 6.4.7 Sony Group Corporation
- 6.4.8 Rakuten Group, Inc.
- 6.4.9 Lionsgate Plc
- 6.4.10 Orange S.A.
- 6.4.11 America Movil, S.A.B. de C.V.
- 6.4.12 Fetch TV Pty Limited
- 6.4.13 CHILI S.p.A.
- 6.4.14 Pathe SAS
- 6.4.15 SF Studios AB
- 6.4.16 JioStar Media and Distribution Ltd.
- 6.4.17 Zee Entertainment Enterprises Limited
- 6.4.18 Preemz, LLC
- 6.4.19 Plex, Inc.
- 6.4.20 DIRECTV, LLC
7 MARKET OPPORTUNITIES AND FUTURE OUTLOOK
- 7.1 White-Space and Unmet-Need Assessment

