PUBLISHER: Mordor Intelligence | PRODUCT CODE: 2100016

PUBLISHER: Mordor Intelligence | PRODUCT CODE: 2100016
6G - Market Share Analysis, Industry Trends & Statistics, Growth Forecasts (2025 - 2030)
According to Mordor Intelligence, the 6G market is valued at USD 0.26 billion in 2025 and is projected to reach USD 3.88 billion by 2030, reflecting a compound annual growth rate (CAGR) of 72.6%.
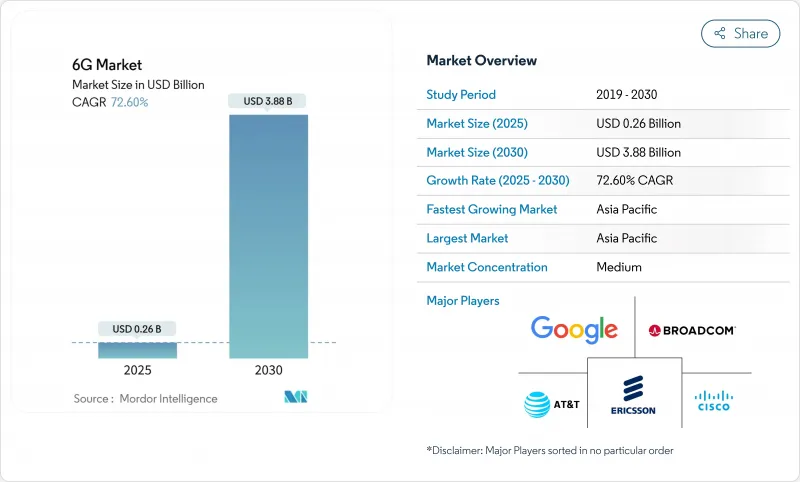
[1] IEEE Staff, "Terahertz Communications for 6G," IEEE Xplore, ieeexplore.ieee.org The surge is propelled by terahertz-band spectrum, artificial intelligence (AI) integration across the network stack, and the early commercialisation of non-terrestrial networks that extend coverage beyond traditional cell sites. This report is Segmented by Devices (Mobile Devices, Iot and Edge Devices, and More), Component (Hardware, Software, and Services), End-User Vertical (Automotive and Transportation, Manufacturing and Industrial, and More), Frequency Band (Sub-Terahertz (sub-THz) and Terahertz), and Geography.
Global 6G Market Trends and Insights
Exploding Data Demand and Ultra-Low Latency Use-Cases
Terabit-class extended-reality workloads now exceed 100 Gbps, forcing operators to redesign back-haul and fronthaul topologies. NTT DOCOMO's 2024 lab trials delivered 280 Gbps in the terahertz band, validating spectral maturity for industrial digital twins and holographic conferencing. In manufacturing, John Deere's low-latency private network improved predictive maintenance cycles and robotic coordination, setting a benchmark for 6G in Industry 4.0 settings. Healthcare demands are equally stringent; telesurgery demos over 5G at a 99-millisecond round-trip have already shaped the performance baseline for 6G medical links. AI model training at the edge compounds throughput pressure because large parameter updates must synchronise across thousands of nodes in real time, making deterministic latency a pre-requisite for distributed learning.
AI-Enabled Edge and IoT Device Proliferation
NVIDIA's AI Aerial platform brings real-time machine-learning inference into the radio layer, driving a network-wide shift toward distributed intelligence. Lightweight transformer models now generate 5-12 tokens per second on Raspberry Pi clusters, underscoring the feasibility of local inference without cloud dependency. As global IoT endpoints approach 75 billion by 2030, energy-harvesting radios using ambient RF are essential for battery-free operation, underpinning continuous connectivity models ResearchGate. Edge computing cuts long-haul traffic but heightens reliability needs, since millions of autonomous devices must reach consensus in microseconds to collaborate safely in real-world environments.
Multi-Billion-Dollar THz Infrastructure and Back-Haul CAPE
Capital intensity is the primary headwind. Operators are trimming spend after heavy 5G roll-outs, prioritising software overlays before green-lighting dense THz small-cell grids. Terahertz propagation limits demand more base stations per square kilometre than 5G, pushing site-acquisition and power costs upward. Open RAN reduces vendor lock-in yet raises integration complexity, delaying return on investment MDPI. Cloud-native cores spread cost over time by shifting from capital expenditure to consumption-based models, but the financial benefit only materialises once adoption scales.
Other drivers and restraints analyzed in the detailed report include:
- Government R&D Grants and Early Spectrum Policies
- Integration with Non-Terrestrial / Satellite Networks
- Spectrum Allocation Uncertainty in Sub-THz and THz Bands
For complete list of drivers and restraints, kindly check the Table Of Contents.
Segment Analysis
The mobile segment commanded 46% of 6G market share in 2024 on the back of smartphone dominance, but IoT and edge devices are expanding at a sector-leading 73.22% CAGR, underscoring a shift toward machine-centric traffic patterns. Rising shipments of fixed wireless access units enable rural households to achieve fibre-like speeds, creating an interim revenue stream for operators before handheld mass adoption.
Edge devices embed local AI chips that prune data at the source, improving spectral efficiency without sacrificing insight accuracy. X-MIMO prototypes in the 7 GHz band from Samsung demonstrate how handset antenna innovations will offset high-frequency path loss in urban canyons. Meanwhile, ruggedised industrial sensors and vehicle communication modules add resilience features such as built-in energy harvesters, widening use-case diversity.
The proliferation of autonomous drones, agricultural robots, and AR headsets increases node density by orders of magnitude, driving incremental infrastructure requirements. Enterprise demand for private 6G networks, often anchored by IoT gateways, positions device diversity as both a technical challenge and a revenue multiplier for service providers. As AI workloads migrate to the edge, firmware updates and security patches will account for a growing share of traffic, reinforcing the primacy of zero-touch device-management platforms.
Hardware still represented 54% of the 6G market size in 2024, covering radio front-ends, phased-array antennas, and compound-semiconductor chipsets. However, the software stack is scaling at 77.10% CAGR as operators deploy cloud-native cores and AI-driven orchestration that permit over-the-air feature activation without hardware swaps.
Open RAN splits baseband and radio functions, allowing software vendors to iterate on scheduling, beamforming, and network slicing. NVIDIA's AI Aerial suite illustrates how real-time reinforcement-learning agents optimise cell throughput in milliseconds by tuning modulation schemes on the fly. Service segments-covering planning, integration, and lifecycle management-benefit from recurring revenue as carriers move to subscription pricing for network functions.
Compound-semiconductor advances remain critical for power efficiency in terahertz power amplifiers. Yet value is tilting toward algorithmic control that extracts more capacity from each hertz. Consequently, vendor differentiation hinges on update velocity, not silicon lead-time, reconfiguring ecosystem alliances among traditional equipment makers, hyperscalers and software start-ups.
Complete Report Scope:
- By Devices
- Mobile Devices
- IoT and Edge Devices
- Fixed Wireless Access CPE
- Network Infrastructure Equipment
- Other Devices
- By Component
- Hardware
- Software
- Services
- By End-user Vertical
- Automotive and Transportation
- Manufacturing and Industrial
- Healthcare and Life Sciences
- Agriculture and Smart Farming
- Government and Public Safety
- Media and Entertainment
- Other Verticals
- By Frequency Band
- Sub-terahertz (sub-THz) (100-300 GHz)
- Terahertz (above 300 GHz)
- By Geography
- North America
- United States
- Canada
- Mexico
- South America
- Brazil
- Argentina
- Rest of South America
- Europe
- Germany
- United Kingdom
- France
- Italy
- Spain
- Russia
- Rest of Europe
- Asia Pacific
- China
- Japan
- South Korea
- India
- Australia
- Rest of Asia Pacific
- Middle East and Africa
- Saudi Arabia
- United Arab Emirates
- South Africa
- Rest of Middle East and Africa
- North America
Geography Analysis
Asia-Pacific led with 36% of the 6G market in 2024 and is scaling fastest at a 74.08% CAGR through 2030. China launched the first 6G test satellite in 2024, while South Korea's public-private roadmap aims for commercial 6G in 2028. Japan's Beyond 5G Promotion Consortium has already demonstrated terahertz transmissions above 100 Gbps, underscoring the region's integrated device-fabrication and field-trial ecosystem. Dense urban clusters reduce per-capita infrastructure cost and create early-adopter revenue pools that further accelerate investment cycles.
North America benefits from substantial federal grants and cloud-native leadership. The USD 420 million federal innovation fund catalyses open-source RAN deployments, giving domestic vendors a seat at the standards table. Silicon Valley's AI leadership positions U.S. firms to define network-intelligence frameworks, though reliance on imported gallium and indium phosphide chips remains a supply-chain weak spot. Cross-border spectrum alignment with Canada and Mexico narrows roaming gaps and enlarges the addressable subscriber base.
Europe channels policy energy into sustainability and harmonised regulation. The Smart Networks and Services Joint Undertaking deploys EUR 500 million to nurture green radios and energy-harvesting devices. Germany and the United Kingdom spearhead testbeds for satellite-terrestrial networks, while France and Italy exploit aerospace expertise to refine optical inter-satellite links. Fragmented national rules slow pan-European roll-outs, yet common research agendas and roaming directives mitigate divergence. The Middle East and Africa, though smaller today, rely on LEO satellite back-haul to leapfrog fibre gaps, positioning those regions for rapid catch-up once handset prices fall below mass-market thresholds.
- AT&T
- Broadcom
- Cisco
- Ericsson
- Huawei
- Nokia
- NTT Docomo
- Orange
- NEC Corporation
- Samsung
- Qualcomm
- Intel
- ZTE
- China Mobile
- Verizon
- SK Telecom
- Keysight Technologies
- Rohde & Schwarz
- MediaTek
- Telefonica
- Vodafone
Additional Benefits:
- The market estimate (ME) sheet in Excel format
- 3 months of analyst support
TABLE OF CONTENTS
1 INTRODUCTION
- 1.1 Study Assumptions and Market Definition
- 1.2 Scope of the Study
2 RESEARCH METHODOLOGY
3 EXECUTIVE SUMMARY
4 MARKET LANDSCAPE
- 4.1 Market Overview
- 4.2 Market Drivers
- 4.2.1 Exploding data demand and ultra-low latency use-cases
- 4.2.2 Proliferation of AI-enabled edge and IoT devices
- 4.2.3 Government R&D grants and early spectrum policies
- 4.2.4 Integration with non-terrestrial / satellite networks
- 4.2.5 Programmable Reconfigurable Intelligent Surfaces (RIS) deployment
- 4.2.6 Green communications mandates for energy-harvesting THz radios
- 4.3 Market Restraints
- 4.3.1 Multi-billion-dollar THz infrastructure and back-haul CAPEX
- 4.3.2 Spectrum allocation uncertainty in sub-THz and THz bands
- 4.3.3 Public-health pushback on continuous THz exposure
- 4.3.4 Compound-semiconductor (InP, GaN) supply-chain bottlenecks
- 4.4 Value Chain Analysis
- 4.5 Regulatory Landscape
- 4.6 Technological Outlook
- 4.7 Porter's Five Forces Analysis
- 4.7.1 Bargaining Power of Buyers
- 4.7.2 Bargaining Power of Suppliers
- 4.7.3 Threat of New Entrants
- 4.7.4 Threat of Substitutes
- 4.7.5 Intensity of Competitive Rivalry
5 MARKET SIZE AND GROWTH FORECASTS (VALUE)
- 5.1 By Devices
- 5.1.1 Mobile Devices
- 5.1.2 IoT and Edge Devices
- 5.1.3 Fixed Wireless Access CPE
- 5.1.4 Network Infrastructure Equipment
- 5.1.5 Other Devices
- 5.2 By Component
- 5.2.1 Hardware
- 5.2.2 Software
- 5.2.3 Services
- 5.3 By End-user Vertical
- 5.3.1 Automotive and Transportation
- 5.3.2 Manufacturing and Industrial
- 5.3.3 Healthcare and Life Sciences
- 5.3.4 Agriculture and Smart Farming
- 5.3.5 Government and Public Safety
- 5.3.6 Media and Entertainment
- 5.3.7 Other Verticals
- 5.4 By Frequency Band
- 5.4.1 Sub-terahertz (sub-THz) (100-300 GHz)
- 5.4.2 Terahertz (above 300 GHz)
- 5.5 By Geography
- 5.5.1 North America
- 5.5.1.1 United States
- 5.5.1.2 Canada
- 5.5.1.3 Mexico
- 5.5.2 South America
- 5.5.2.1 Brazil
- 5.5.2.2 Argentina
- 5.5.2.3 Rest of South America
- 5.5.3 Europe
- 5.5.3.1 Germany
- 5.5.3.2 United Kingdom
- 5.5.3.3 France
- 5.5.3.4 Italy
- 5.5.3.5 Spain
- 5.5.3.6 Russia
- 5.5.3.7 Rest of Europe
- 5.5.4 Asia Pacific
- 5.5.4.1 China
- 5.5.4.2 Japan
- 5.5.4.3 South Korea
- 5.5.4.4 India
- 5.5.4.5 Australia
- 5.5.4.6 Rest of Asia Pacific
- 5.5.5 Middle East and Africa
- 5.5.5.1 Saudi Arabia
- 5.5.5.2 United Arab Emirates
- 5.5.5.3 South Africa
- 5.5.5.4 Rest of Middle East and Africa
- 5.5.1 North America
6 COMPETITIVE LANDSCAPE
- 6.1 Market Concentration
- 6.2 Strategic Moves
- 6.3 Market Share Analysis
- 6.4 Company Profiles (includes Global level Overview, Market level overview, Core Segments, Financials as available, Strategic Information, Market Rank/Share for key companies, Products and Services, and Recent Developments)
- 6.4.1 AT&T
- 6.4.2 Broadcom
- 6.4.3 Cisco
- 6.4.4 Ericsson
- 6.4.5 Google
- 6.4.6 Huawei
- 6.4.7 Nokia
- 6.4.8 NTT Docomo
- 6.4.9 Orange
- 6.4.10 NEC Corporation
- 6.4.11 Samsung
- 6.4.12 Qualcomm
- 6.4.13 Intel
- 6.4.14 ZTE
- 6.4.15 China Mobile
- 6.4.16 Verizon
- 6.4.17 SK Telecom
- 6.4.18 Keysight Technologies
- 6.4.19 Rohde & Schwarz
- 6.4.20 MediaTek
- 6.4.21 Telefonica
- 6.4.22 Vodafone
7 MARKET OPPORTUNITIES AND FUTURE OUTLOOK
- 7.1 White-space and Unmet-need Assessment

