PUBLISHER: Mordor Intelligence | PRODUCT CODE: 2100493

PUBLISHER: Mordor Intelligence | PRODUCT CODE: 2100493
Ophthalmic Drugs - Market Share Analysis, Industry Trends & Statistics, Growth Forecasts (2026 - 2031)
According to Mordor Intelligence, the ophthalmic drugs market size was valued at USD 37.49 billion in 2025 and is estimated to grow from USD 40.58 billion in 2026 to reach USD 60.29 billion by 2031, at a CAGR of 8.24% during the forecast period (2026-2031).
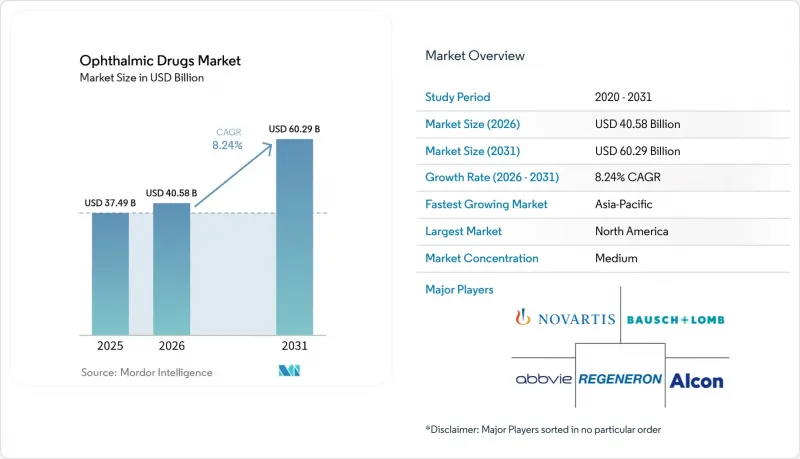
This report is Segmented by Drug Class (Anti-Glaucoma Drugs, Dry Eye Drugs, and More), Indication (Glaucoma, Dry Eye Syndrome, and More), Dosage Form (Eye Drops, Ointments & Gels, and More), Product Type (OTC Drugs and Prescription Drugs), Distribution Channel (Hospital Pharmacies, and More), and Geography (North America, Europe, and More). The Market Forecasts are Provided in Terms of Value (USD).
Global Ophthalmic Drugs Market Trends and Insights
Aging Population And Chronic Ocular Disease Prevalence Surge
Global life expectancy gains are swelling the population aged 60 and above, which the United Nations forecasts will double to 2.1 billion by 2050. Higher age correlates strongly with glaucoma, macular degeneration, and cataract diagnoses, prompting payers to prioritize preventative screening. Japan illustrates the pressure point: a 29% senior-citizen share in 2026 coincides with a 12% rise in glaucoma diagnoses since 2020, taxing clinic capacity and propelling demand for at-home monitoring and quarterly implants. Health systems now encourage self-administered or outpatient therapies to contain procedure costs, pushing manufacturers toward long-acting inserts that reduce visit frequency. These dynamics amplify the ophthalmic drugs market's growth runway, especially for sustained-release formats. Venture funding also gravitates toward devices that pair with digital adherence apps to manage therapy outside clinical settings, creating new opportunities across the ophthalmic drugs market.
Rising Diabetes Incidence Driving Retinal Disorder Therapies
Diabetic retinopathy and macular edema track the diabetes epidemic, which the International Diabetes Federation expects to swell to 783 million adults by 2045. The U.S. FDA cleared EYLEA HD in 2023, extending intravitreal dosing intervals to 16 weeks, lessening clinic loads while preserving efficacy. Genentech's Susvimo port-delivery system earned approval in 2024, shifting revenue toward refill cartridges rather than episodic injections. These innovations create annuity-style cash flows and intensify competition in the retinal segment of the ophthalmic drugs market. Payers, recognizing avoided procedure costs, have demonstrated reimbursement flexibility for technologies that cut injection frequency. Consequently, capital allocation is tilting toward device-assisted delivery that can secure premium pricing and loyalty, further strengthening investment across the ophthalmic drugs market.
Patent Expiries And Generic Erosion Compressing Margins
Lucentis biosimilars entered Europe in 2022 and the United States in 2024 at 30% discounts, slicing incumbents' revenue trajectories. Generic timolol prices fell further when preservative-free versions debuted in the U.S. market at 40% below legacy brands. Innovators respond with extended-release or high-dose variants, yet Medicare price-negotiation clauses amplify pressure. Net effect: short-term revenue declines that temper ophthalmic drugs market expansion until replacement products scale.
Other drivers and restraints analyzed in the detailed report include:
- Rx-to-OTC Switches Expanding Consumer Access
- Gene And Cell-Therapy Pipeline Attracting New Capital
- High Formulation Complexity And Stringent Sterility Regulations
For complete list of drivers and restraints, kindly check the Table Of Contents.
Segment Analysis
Retinal therapeutics generated the largest revenue increment in 2025 and are advancing at a 16.25% CAGR, while anti-glaucoma drugs, which held 27.56% of the ophthalmic drugs market share in 2025, are expanding more slowly. The ophthalmic drugs market size for retinal therapies will expand further as high-dose anti-VEGF biologics and gene therapies move into commercial channels. Apellis's Syfovre launched the first lesion-slowing treatment for geographic atrophy, unlocking a U.S. patient pool exceeding 1 million. Dry eye therapeutics, led by Bausch + Lomb's lipid-based Miebo, continue to post double-digit growth owing to digital-screen fatigue in working adults. Anti-infective lines suffer from antimicrobial-resistance concerns; however, fourth-generation fluoroquinolones approved in 2024 offer broader coverage. Combination therapies like Rocklatan simplify regimens and justify premiums but remain niche because of price sensitivity.
During 2026-2031, investment gravitates toward retinal and dry eye mechanisms with de-risked reimbursement pathways. Anti-glaucoma innovation focuses on preservative-free or once-weekly drops, reflecting incremental rather than breakthrough change. Capital flows mirror this divergence: venture funding chases retinal gene therapy platforms, while private equity backs manufacturing scale-ups for generic glaucoma formulations.
Retinal indications secured 35.53% of 2025 sales and maintain pricing power because therapies often cost more than USD 2,000 per injection. Ocular infections and inflammation, buoyed by rising cataract surgeries, are predicted to post a 12.85% CAGR. Dry eye therapies receive a lift from alternative delivery modes like Tyrvaya's nasal spray, widening access for contact-lens wearers and screen-heavy professionals. Glaucoma volumes remain high but revenue growth lags due to generics. Allergic conjunctivitis is steady yet migratory toward OTC, thinning prescription tallies. Presbyopia treatments are emerging, with Vuity's 2023 launch validating pharmacologic accommodation modulation.
Segment differentials will persist: retinal care benefits most from biologic and gene therapy advances, while infections leverage novel antibiotics to stay ahead of resistance. Manufacturers aiming at glaucoma need neuroprotective angles or device-based adherence solutions to reignite growth.
Complete Report Scope:
- By Drug Class
- Anti-glaucoma Drugs
- Dry Eye Drugs
- Anti-inflammatory Drugs
- Anti-infective Drugs
- Retinal Disorder Drugs
- Anti-allergy Drugs
- Combination Therapies
- By Indication
- Glaucoma
- Dry Eye Syndrome
- Retinal Disorders
- Allergic Conjunctivitis
- Ocular Infections & Inflammation
- Others (Presbyopia, Post-surgical, Rare Diseases)
- By Dosage Form
- Eye Drops
- Ointments & Gels
- Capsules & Tablets
- Implants & Inserts
- Sprays & Nasal Delivery
- By Product Type
- Prescription Drugs
- OTC Drugs
- By Distribution Channel
- Hospital Pharmacies
- Retail Pharmacies & Drug Stores
- Online Pharmacies
- Geography
- North America
- United States
- Canada
- Mexico
- Europe
- Germany
- United Kingdom
- France
- Italy
- Spain
- Rest of Europe
- Asia-Pacific
- China
- Japan
- India
- South Korea
- Australia
- Rest of Asia-Pacific
- Middle East & Africa
- GCC
- South Africa
- Rest of Middle East & Africa
- South America
- Brazil
- Argentina
- Rest of South America
- North America
Geography Analysis
North America generated 42.13% of 2025 revenue, supported by Medicare Part B coverage of anti-VEGF injections and early uptake of premium implants. The region benefits from robust clinician density and high diagnostic rates, sustaining elevated per-capita spending levels. Canada and Mexico, while smaller, exhibit generic adoption that tempers unit prices but broadens access. Competitive launches like EYLEA HD cement biologics' hold, and payer frameworks continue to reimburse innovations that reduce clinic visits.
Europe represents a mature yet regulation-intensive landscape. Centralized EMA approvals streamline multi-nation launches, but national health technology assessments demand real-world evidence, compressing margins. Germany, France, and the United Kingdom remain launch priorities, though reference pricing keeps price escalation in check. The ophthalmic drugs market size in Europe grows steadily from sustained-release approvals that demonstrate cost offset against surgical resource use. Climate-driven preservative restrictions are steeper here, compelling earlier reformulation investment.
Asia-Pacific is the fastest-growing territory at a 12.21% CAGR through 2031, propelled by China's expanded reimbursement list and India's API self-sufficiency pushes. Urbanization and myopia epidemics add demand for glaucoma and retinal therapies. Japan's senior population maintains high prescription volumes, while Australia and South Korea serve as early-adopter hubs for digital adherence platforms. Local manufacturers leverage production-linked incentives to capture regional share, sharpening price competition but also enlarging patient reach. Southeast Asian nations invest in tele-ophthalmology to bridge specialist shortages, funneling prescriptions through online pharmacy channels.
Latin America and the Middle East & Africa collectively remain modest contributors but register double-digit growth off low bases. Brazilian generic houses are scaling topical formulations, and Gulf Cooperation Council nations invest in vision-care infrastructure. Currency volatility and tariff barriers temper premium biologic uptake, yet public-health campaigns to reduce blindness ensure baseline therapy demand.
- Abbvie
- Aerie Pharmaceutical
- Alcon
- Alimera Sciences Inc.
- Apellis Pharmaceuticals Inc.
- Bausch & Lomb Corporation
- Bayer
- EyePoint Pharmaceuticals Inc.
- Roche
- Glaukos
- Johnson & Johnson
- Nicox
- Novaliq
- Novartis
- Ocular Therapeutix Inc.
- Otsuka
- Regeneron Pharmaceuticals
- Santen Pharmaceuticals
- Sun Pharmaceuticals Industries
- Teva Pharmaceutical Industries
- Viatris
Additional Benefits:
- The market estimate (ME) sheet in Excel format
- 3 months of analyst support
TABLE OF CONTENTS
1 Introduction
- 1.1 Study Assumptions & Market Definition
- 1.2 Scope of the Study
2 Research Methodology
3 Executive Summary
4 Market Landscape
- 4.1 Market Overview
- 4.2 Market Drivers
- 4.2.1 Aging population & chronic ocular disease prevalence surge
- 4.2.2 Rising diabetes incidence driving retinal disorder therapies
- 4.2.3 Rx-to-OTC switches expanding consumer access
- 4.2.4 Gene & cell-therapy pipeline attracting new capital
- 4.2.5 AI-assisted drug discovery shortening development cycles
- 4.2.6 Localized API manufacturing triggered by tariff & supply-chain risk
- 4.3 Market Restraints
- 4.3.1 Patent expiries & generic erosion compressing margins
- 4.3.2 High formulation complexity and stringent sterility regulations
- 4.3.3 Patient non-adherence to multi-dose regimens limiting efficacy
- 4.3.4 Climate-driven preservative bans raising reformulation costs
- 4.4 Supply-Chain Analysis
- 4.5 Regulatory Landscape
- 4.6 Technological Outlook
- 4.7 Porter's Five Forces Analysis
- 4.7.1 Threat of New Entrants
- 4.7.2 Bargaining Power of Buyers/Consumers
- 4.7.3 Bargaining Power of Suppliers
- 4.7.4 Threat of Substitute Products
- 4.7.5 Intensity of Competitive Rivalry
5 Market Size & Growth Forecasts (Value, USD)
- 5.1 By Drug Class
- 5.1.1 Anti-glaucoma Drugs
- 5.1.2 Dry Eye Drugs
- 5.1.3 Anti-inflammatory Drugs
- 5.1.4 Anti-infective Drugs
- 5.1.5 Retinal Disorder Drugs
- 5.1.6 Anti-allergy Drugs
- 5.1.7 Combination Therapies
- 5.2 By Indication
- 5.2.1 Glaucoma
- 5.2.2 Dry Eye Syndrome
- 5.2.3 Retinal Disorders
- 5.2.4 Allergic Conjunctivitis
- 5.2.5 Ocular Infections & Inflammation
- 5.2.6 Others (Presbyopia, Post-surgical, Rare Diseases)
- 5.3 By Dosage Form
- 5.3.1 Eye Drops
- 5.3.2 Ointments & Gels
- 5.3.3 Capsules & Tablets
- 5.3.4 Implants & Inserts
- 5.3.5 Sprays & Nasal Delivery
- 5.4 By Product Type
- 5.4.1 Prescription Drugs
- 5.4.2 OTC Drugs
- 5.5 By Distribution Channel
- 5.5.1 Hospital Pharmacies
- 5.5.2 Retail Pharmacies & Drug Stores
- 5.5.3 Online Pharmacies
- 5.6 Geography
- 5.6.1 North America
- 5.6.1.1 United States
- 5.6.1.2 Canada
- 5.6.1.3 Mexico
- 5.6.2 Europe
- 5.6.2.1 Germany
- 5.6.2.2 United Kingdom
- 5.6.2.3 France
- 5.6.2.4 Italy
- 5.6.2.5 Spain
- 5.6.2.6 Rest of Europe
- 5.6.3 Asia-Pacific
- 5.6.3.1 China
- 5.6.3.2 Japan
- 5.6.3.3 India
- 5.6.3.4 South Korea
- 5.6.3.5 Australia
- 5.6.3.6 Rest of Asia-Pacific
- 5.6.4 Middle East & Africa
- 5.6.4.1 GCC
- 5.6.4.2 South Africa
- 5.6.4.3 Rest of Middle East & Africa
- 5.6.5 South America
- 5.6.5.1 Brazil
- 5.6.5.2 Argentina
- 5.6.5.3 Rest of South America
- 5.6.1 North America
6 Competitive Landscape
- 6.1 Market Concentration
- 6.2 Market Share Analysis
- 6.3 Company Profiles (includes Global level Overview, Market level overview, Core Segments, Financials as available, Strategic Information, Market Rank/Share for key companies, Products & Services, and Recent Developments)
- 6.3.1 AbbVie (Allergan)
- 6.3.2 Aerie Pharmaceuticals Inc.
- 6.3.3 Alcon Inc.
- 6.3.4 Alimera Sciences Inc.
- 6.3.5 Apellis Pharmaceuticals Inc.
- 6.3.6 Bausch & Lomb Corporation
- 6.3.7 Bayer AG
- 6.3.8 EyePoint Pharmaceuticals Inc.
- 6.3.9 F. Hoffmann-La Roche Ltd
- 6.3.10 Glaukos Corporation
- 6.3.11 Johnson & Johnson Vision
- 6.3.12 Nicox SA
- 6.3.13 Novaliq GmbH
- 6.3.14 Novartis AG
- 6.3.15 Ocular Therapeutix Inc.
- 6.3.16 Otsuka Pharmaceutical Co. Ltd
- 6.3.17 Regeneron Pharmaceuticals Inc.
- 6.3.18 Santen Pharmaceutical Co. Ltd
- 6.3.19 Sun Pharmaceutical Industries Ltd.
- 6.3.20 Teva Pharmaceutical Industries Ltd.
- 6.3.21 Viatris Inc.
7 Market Opportunities & Future Outlook
- 7.1 White-space & Unmet-need Assessment

