
PUBLISHER: SNS Research | PRODUCT CODE: 2040973

PUBLISHER: SNS Research | PRODUCT CODE: 2040973
Ophthalmic Drugs Market, 2026 - 2036: Disease Landscape, Pipeline, Commercial Dynamics and Forecasts
Synopsis:
The global ophthalmic drugs market is at an inflection point. Demographic ageing, the global diabetes epidemic, and a wave of mechanistically novel approvals since 2023 have simultaneously expanded the addressable patient population, opened commercial categories that did not exist three years ago, and set in motion a structural transition in how ophthalmic diseases are treated. This transition is moving from chronic daily self-administration toward physician-administered sustained-release systems and, ultimately, toward single-administration gene therapy platforms. These shifts are occurring across all major disease areas concurrently and at a pace that is compressing the typical product lifecycle timeline for incumbent therapies.
Global ophthalmic drug revenues reached approximately $46.8 billion in 2026 and are projected to grow at a CAGR of 5.7% through 2030, driven by the commercial maturation of biologic anti-VEGF therapies, the entry of the first approved treatments for geographic atrophy, the structural re-rating of the dry eye disease market, and the progressive transition toward gene therapy and sustained-release delivery platforms.
The market is undergoing structural bifurcation. The established anti-VEGF segment faces accelerating biosimilar competition following the approval of multiple aflibercept and ranibizumab biosimilars, with net pricing compression intensifying through 2027 as remaining entrants complete patent settlement timelines. Simultaneously, the 2023 approval class opened premium-priced categories with no near-term generic competition: pegcetacoplan and avacincaptad pegol for geographic atrophy, perfluorohexyloctane and water-free cyclosporine for dry eye disease, travoprost intracameral implant for glaucoma, and lotilaner for Demodex blepharitis. Faricimab (Vabysmo), the first bispecific antibody approved in ophthalmology, exceeded $4 billion in annual revenues in 2024 and has repositioned the wet AMD standard of care around mechanism differentiation and extended durability. Eylea HD received FDA approval in April 2026 for dosing intervals of up to 20 weeks, the longest approved interval for any injectable anti-VEGF, extending Regeneron's franchise defense strategy against biosimilar displacement.
Topics Covered:
The report covers the following topics:
- Global ophthalmic drugs market sizing, segmentation, and forecasts from 2021 to 2036
- Market drivers, barriers, and macro-environmental trends
- Approved drug classes and leading commercial products across all major ophthalmic indications
- 2026 pipeline review across 140 active candidates
- Advanced drug delivery technologies and innovation platforms
- Future roadmap for ophthalmic drug development to 2036
- Ophthalmic drugs value chain analysis
- Company profiles and strategies of over 100 leading ecosystem players
- Competitive landscape including acquisitions, alliances, and consolidation
- Strategic recommendations for developers, investors, and healthcare stakeholders
Sample Figure:
The pipeline through 2036 is amongst the most consequential in the history of the category. Three Phase III gene therapy programs targeting wet AMD, specifically 4D-150 (4D Molecular Therapeutics), Ixo-vec (Eli Lilly/Adverum Biotechnologies), and surabgene lomparvovec (AbbVie/REGENXBIO), carry the potential to restructure the anti-VEGF market from a chronic injection model to single or infrequent administration. AXPAXLI (Ocular Therapeutix) reported Phase III superiority over aflibercept 2 mg in February 2026 and is approaching NDA submission as the first TKI implant for wet AMD. In glaucoma, iDose TR (Glaukos) generated approximately $54 million in US revenue in a single quarter in early 2026, validating the interventional model at commercial scale. In geographic atrophy, the Phase III ARCHER II trial of vonaprument (Annexon) is expected to deliver the first functional vision endpoint data from a pivotal GA trial in H2 2026. In dry eye disease, three first-in-class mechanisms received FDA approval between 2021 and 2025, making it the fastest-growing major therapeutic category in ophthalmology by revenue CAGR over the 2026 to 2030 period.
The “Ophthalmic Drugs Market 2026 to 2036: Disease Landscape, Pipeline, Commercial Dynamics and Forecasts” report provides a comprehensive assessment of the global ophthalmic drugs market from 2026 to 2036, covering the disease landscape, R&D pipeline, competitive dynamics, biosimilar competition, delivery innovation, and strategic outlook. The report additionally includes profiles and strategies of leading ophthalmic drug developers, biopharmaceutical companies, biosimilar manufacturers, and specialist biotechs active across the value chain.
Market size forecasts are segmented across 6 therapeutic categories, 5 routes of administration, 3 distribution channels, 4 drug types, 2 prescription status categories, 3 patent status categories, 5 regional markets, and 26 country markets. The pipeline analysis covers 140 active candidates across six mechanistic classes and four strategic classifications. The report is accompanied by an Excel datasheet suite covering all quantitative forecast data and the full pipeline dataset.
Key Findings:
The report has the following key findings:
- Global ophthalmic drug revenues are estimated to surpass $46.8 billion in 2026, with a compound annual growth rate of 5.7%, as mechanistically novel approvals across retinal disease, glaucoma, and dry eye disease expand the addressable treated market and establish commercial categories where none previously existed.
- AMD and retinal disease, glaucoma, dry eye disease, and diabetic eye disease collectively account for approximately 92% of all active pipeline candidates in the 2026 dataset.
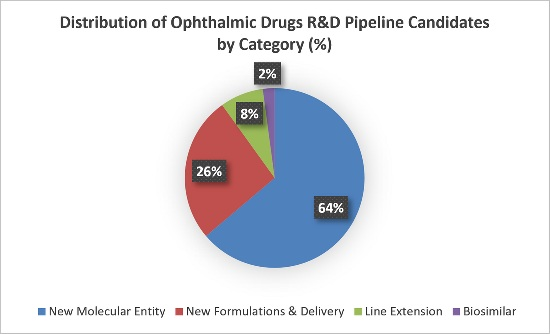
- Cell and gene therapies now constitute 19% of the active pipeline, the fastest-growing mechanistic category and the most structurally significant shift in ophthalmic drug development since the introduction of anti-VEGF biologics.
- The competitive frontier in wet AMD has moved beyond injection frequency reduction toward duration elimination. The first sustained-release TKI implant has reported Phase 3 superiority over the anti-VEGF standard of care, and three Phase 3 gene therapy programs are targeting single or annual administration, developments expected to fundamentally restructure the volume economics of the largest segment in the ophthalmic drugs market.
- Geographic atrophy has transitioned from an unaddressed indication to an actively contested market since 2023, yet neither approved therapy has demonstrated functional vision benefit. The next generation of complement, neuroprotective, and gene therapy programs is targeting this clinical gap, with Phase 3 functional endpoint data anticipated within the forecast period.
- Glaucoma pharmacotherapy is undergoing a structural shift from daily patient-administered drops toward physician-administered sustained-release systems. The first intracameral procedural pharmaceutical generated approximately $54 million in US revenues in a single quarter in early 2026, and a pipeline of next-generation intracameral, intracanalicular, and transdermal platforms is approaching regulatory submission.
- The dry eye disease market has been structurally re-rated by multiple first-in-class approvals since 2021 and represents the fastest-growing major therapeutic category in ophthalmology by revenue CAGR over the 2026 to 2030 period, with further mechanism-diverse pipeline entrants expected to deepen the category through the forecast period.
- Drug delivery innovation has become as commercially consequential as molecular innovation across all ophthalmic therapeutic categories. Bioresorbable implants, suprachoroidal delivery, preservative-free platforms, and gene therapy are collectively redefining durability, compliance, and treatment burden across retinal disease, glaucoma, and dry eye disease.
Key Questions Answered:
The report provides answers to the following key questions:
- How large is the global ophthalmic drugs market in 2026, and what is the revenue and growth outlook through 2036?
- Which therapeutic categories and regional markets offer the highest growth potential over the forecast period?
- How are gene and cell therapies reshaping the competitive and clinical landscape of ophthalmic drug development?
- What is the current and future commercial impact of sustained-release drug delivery innovation across all major ophthalmic indications?
- How will biosimilar competition in the anti-VEGF segment reshape market dynamics, and how are innovator companies responding?
- Which late-stage pipeline programs represent the most significant near-term clinical and commercial catalysts?
- How will patent expirations of major innovator drugs affect market structure and competitive positioning?
- Who are the key companies shaping the ophthalmic drugs competitive landscape, and what strategies are defining their positions?
- What are the implications of macro-environmental trends including health technology assessment pressures, pricing reform, and digital health integration for ophthalmic drug developers and investors?
- What strategic actions should developers, investors, and healthcare stakeholders take to capitalize on the opportunities in ophthalmic drugs through 2036?
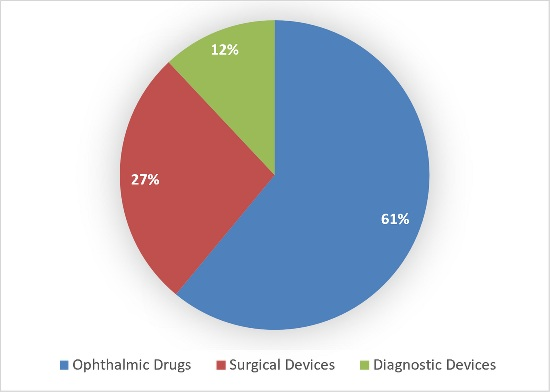
Sample Figure: Global Ophthalmic Product Spending by Submarket (%)
Forecast Segmentation:
The report provides detailed revenue forecasts across multiple dimensions of the ophthalmic drugs market, including:
Therapeutic Area
- Anti-Infectives
- Allergy & Anti-Inflammatory
- Dry Eye
- Glaucoma
- Retinal Disorders
- Other Disorders
Route of Administration
- Topical (Eye Drops / Gels / Ointments)
- Intravitreal
- Sustained-Release (SR) Implants
- Systemic / Others
- Sub Retinal
Distribution Channel
- Hospital / Specialty Pharmacy
- Retail Pharmacy
- Online Pharmacies / D2C
Drug Type
- Small Molecules
- Biologics
- Gene & Cell Therapies
- RNA Therapies
Prescription Status
- Prescription (RX)
- Over-The-Counter (OTC)
Patent Status
- Originator
- Generic
- Biosimilar
Regional Markets
- Asia Pacific
- Europe
- Middle East & Africa
- North America
- Latin & Central America
Country Markets
- Australia
- Brazil
- Canada
- China
- Egypt
- France
- Germany
- Greece
- India
- Israel
- Italy
- Japan
- Mexico
- Netherlands
- Poland
- Portugal
- Russia
- Saudi Arabia
- South Africa
- South Korea
- Spain
- Switzerland
- Taiwan
- Turkey
- UK
- USA
Table of Contents
Chapter 1: Introduction
- 1.1 Executive Summary
- 1.2 Topics Covered
- 1.3 Forecast Segmentation
- 1.4 Key Questions Answered
- 1.5 Key Findings
- 1.6 Methodology
- 1.7 Target Audience
- 1.8 Companies & Organizations Mentioned
Chapter 2: An Overview of Ophthalmic Drugs
- 2.1 What Are Ophthalmic Drugs?
- 2.2 The Role of Drugs in Ophthalmology
- 2.3 Common Eye Disorders
- 2.3.1 Blepharitis
- 2.3.1.1 Anterior Blepharitis
- 2.3.1.2 Posterior Blepharitis
- 2.3.2 Cataracts
- 2.3.3 Chalazion
- 2.3.4 Conjunctivitis
- 2.3.4.1 Allergic Conjunctivitis
- 2.3.4.2 Infective Conjunctivitis
- 2.3.4.3 Irritant Conjunctivitis
- 2.3.5 Diabetic Retinopathy & DME (Diabetic Macular Edema)
- 2.3.6 Dry Eye Disease
- 2.3.7 Glaucoma
- 2.3.7.1 Open-Angle Glaucoma
- 2.3.7.2 Angle-Closure Glaucoma
- 2.3.7.3 Secondary Glaucoma
- 2.3.7.4 Congenital (Infantile) Glaucoma
- 2.3.7.5 NTG (Normal-Tension Glaucoma)
- 2.3.8 Keratitis
- 2.3.9 Macular Degeneration
- 2.3.9.1 Dry AMD
- 2.3.9.2 Wet AMD
- 2.3.10 Ocular Hypertension
- 2.3.11 RVO (Retinal Vein Occlusion)
- 2.3.11.1 CRVO (Central Retinal Vein Occlusion)
- 2.3.12 Uveitis
- 2.3.12.1 Anterior Uveitis
- 2.3.12.2 Intermediate Uveitis
- 2.3.12.3 Posterior Uveitis
- 2.3.13 Geographic Atrophy (GA)
- 2.3.14 Other Conditions
- 2.3.1 Blepharitis
- 2.4 Market Growth Drivers
- 2.4.1 Impact of Eye Disorders on Daily Life
- 2.4.2 Growing Prevalence of Eye Disorders
- 2.4.3 Longevity on the Rise
- 2.4.4 Rising Incidences of Diabetes
- 2.4.5 Lifestyle Habits & Other Factors
- 2.4.6 Advances in Drug Delivery Technologies
- 2.5 Market Barriers
- 2.5.1 Lack of Awareness
- 2.5.2 Patient Compliance
- 2.5.3 Alternative Healing Options
- 2.5.4 Biosimilar Entry and Pricing Pressure
- 2.5.5 Lack of Healthcare Insurance
Chapter 3: Key Application Areas & Leading Therapies
- 3.1 Key Application Areas
- 3.1.1 Anti-Infectives
- 3.1.2 Allergy & Anti-Inflammatory
- 3.1.3 Dry Eye
- 3.1.4 Glaucoma
- 3.1.5 Retinal & Other Disorders
- 3.2 Leading Ophthalmic Drugs
- 3.2.1 Acetazolamide
- 3.2.2 Acoltremon
- 3.2.3 Aflibercept
- 3.2.4 Apraclonidine
- 3.2.5 Azithromycin
- 3.2.6 Besifloxacin
- 3.2.7 Betaxolol
- 3.2.8 Bevacizumab
- 3.2.9 Bimatoprost
- 3.2.10 Brimonidine
- 3.2.11 Brinzolamide
- 3.2.12 Brolucizumab
- 3.2.13 Bromfenac
- 3.2.14 Carbachol
- 3.2.15 Carteolol
- 3.2.16 Cetirizine ophthalmic solution
- 3.2.17 Cenegermin
- 3.2.18 Ciclosporin/Cyclosporine
- 3.2.19 Ciprofloxacin
- 3.2.20 Clobetasol Propionate Ophthalmic
- 3.2.21 Cysteamine
- 3.2.22 Dexamethasone
- 3.2.23 Diclofenac
- 3.2.24 Difluprednate ophthalmic
- 3.2.25 Dipivefrin
- 3.2.26 Diquafosol
- 3.2.27 Dorzolamide
- 3.2.28 Faricimab
- 3.2.29 Fluocinolone
- 3.2.30 Flurbiprofen
- 3.2.31 Ganciclovir
- 3.2.32 Gatifloxacin
- 3.2.33 Hyaluronic Acid (Hyaluronan)
- 3.2.34 Ketorolac
- 3.2.35 Latanoprost
- 3.2.36 Latanoprostene Bunod
- 3.2.37 Levobunolol
- 3.2.38 Levofloxacin
- 3.2.39 Lifitegrast
- 3.2.40 Loteprednol Etabonate
- 3.2.41 Lotilaner
- 3.2.42 Methazolamide
- 3.2.43 Metipranolol
- 3.2.44 Moxifloxacin
- 3.2.45 Nepafenac
- 3.2.46 Netarsudil
- 3.2.47 Ocriplasmin
- 3.2.48 Ofloxacin
- 3.2.49 Olopatadine
- 3.2.50 Pegaptanib
- 3.2.51 Perfluorohexyloctane
- 3.2.52 Phenylephrine
- 3.2.53 Pilocarpine
- 3.2.54 Ranibizumab
- 3.2.55 Rebamipide
- 3.2.56 Ripasudil
- 3.2.57 Sodium Hyaluronate
- 3.2.58 Tafluprost
- 3.2.59 Timolol
- 3.2.60 Tobramycin
- 3.2.61 Travoprost
- 3.2.62 Triamcinolone
- 3.2.63 Trifluridine
- 3.2.64 Unoprostone
- 3.2.65 Valganciclovir
- 3.2.66 Verteporfin
- 3.2.67 Vincristine
- 3.2.68 Voretigene Neparvovec
- 3.2.69 Others & Recent Approvals
- 3.2.69.1 Bimatoprost SR (Sustained-Release)
- 3.2.69.2 Netarsudil/Latanoprost ophthalmic solution
- 3.2.69.3 Omidenepag Isopropyl
- 3.2.69.4 Vizz
- 3.3 Opportunities for Generic & Biosimilar Drugs
- 3.4 Future R&D Pipeline
- 3.4.1 Key Areas of New Drug Development
- 3.4.2 Review of Pipeline Candidates
- 3.4.2.1 AMD & Retinal Disorders
- 3.4.2.2 Diabetic Eye Disease
- 3.4.2.3 Dry Eye Disease
- 3.4.2.4 Glaucoma & Ocular Hypertension
- 3.4.2.5 Ocular Immunology
- 3.4.2.6 Other Indications
Chapter 4: Ophthalmic Drugs Future Roadmap & Value Chain
- 4.1 Future Roadmap
- 4.1.1 Pre-2030: Sustained Delivery and Novel Mechanisms Enter the Market
- 4.1.2 2030 – 2033: Gene and Cell Therapy Reach Commercial Scale
- 4.1.3 2033 – 2036 & Beyond: Precision, Durability, and AI-Integrated Care
- 4.2 Value Chain
- 4.2.1 API Manufacturers & Enabling Technology Providers
- 4.2.2 Generic and Biosimilar Drug Manufacturers
- 4.2.3 Innovator Pharmaceutical Companies
- 4.2.4 Regional Distributors
- 4.2.5 Healthcare Providers, Pharmacies & Drug Stores
Chapter 5: Key Market Players
- 5.1 4D Molecular Therapeutics
- 5.2 AbbVie Inc.
- 5.3 Adverum Biotechnologies Inc. (Eli Lilly and Company)
- 5.4 Alcon Inc.
- 5.5 Aldeyra Therapeutics
- 5.6 Allysta Pharmaceuticals
- 5.7 ANI Pharmaceuticals Inc.
- 5.8 Allegro Ophthalmics LLC
- 5.9 Alteogen Inc.
- 5.10 Amgen Inc.
- 5.11 Amorphex Therapeutics
- 5.12 Annexon Biosciences
- 5.13 Apellis Pharmaceuticals Inc.
- 5.14 Astellas Pharma Inc.
- 5.15 Bausch + Lomb
- 5.16 Bayer AG
- 5.17 Benitec Biopharma Inc.
- 5.18 Bioeq IP AG
- 5.19 BioLight Life Sciences Ltd.
- 5.20 Accure Therapeutics
- 5.21 Lineage Cell Therapeutics Inc.
- 5.22 Bristol-Myers Squibb (BMS)
- 5.23 Cell Cure Neurosciences Ltd.
- 5.24 Chengdu Kanghong Pharmaceuticals Group Ltd.
- 5.25 Chong Kun Dang Pharmaceutical Corporation
- 5.26 Colby Pharmaceutical Company
- 5.27 D.Western Therapeutics Institute Inc.
- 5.28 Optus Pharmaceuticals Co., Ltd.
- 5.29 Dompe Farmaceutici S.p.A.
- 5.30 Euclid Vision Corporation
- 5.31 Kiora Pharmaceuticals Inc.
- 5.32 Focus Laboratories (Part of Cormica)
- 5.33 Fera Pharmaceuticals LLC
- 5.34 PulseSight Therapeutics SAS
- 5.35 Fidia Farmaceutici S.p.A.
- 5.36 Kubota Vision Inc.
- 5.37 TearSolutions Inc.
- 5.38 FUJIFILM Cellular Dynamics, Inc. (FCDI)
- 5.39 Formycon AG
- 5.40 Gene Signal International SA
- 5.41 Gensight Biologics S.A.
- 5.42 Glaukos Corporation
- 5.43 Glycadia Pharmaceuticals
- 5.44 Healios K.K.
- 5.45 Helvetic BioPharma
- 5.46 HitGen Inc.
- 5.47 ID Pharma Co., Ltd.
- 5.48 InMed Pharmaceuticals Inc.
- 5.49 Intas Pharmaceuticals Ltd.
- 5.50 Isarna Therapeutics
- 5.51 Johnson & Johnson Vision
- 5.52 KalVista Pharmaceuticals Inc.
- 5.53 Kissei Pharmaceutical Co., Ltd.
- 5.54 Kodiak Sciences Inc.
- 5.55 Kowa Company
- 5.56 Laboratorios SALVAT S.A.
- 5.57 Lee's Pharmaceutical Holdings
- 5.58 Laboratorios Sophia
- 5.59 Lubris BioPharma LLC
- 5.60 MacuCLEAR Inc.
- 5.61 Keenova Therapeutics
- 5.62 Mannin Research Inc.
- 5.63 Mati Therapeutics Inc.
- 5.64 MC2 Therapeutics A/S
- 5.65 Merck & Co.
- 5.66 MimeTech S.r.l.
- 5.67 Mimetogen Pharmaceuticals
- 5.68 Mitotech S.A.
- 5.69 Mundipharma International Limited
- 5.70 NeuMedics Inc.
- 5.71 Neurotech Pharmaceuticals Inc.
- 5.72 Nicox
- 5.73 Novaliq GmbH
- 5.74 Novartis AG
- 5.75 NovelMed Therapeutics Inc.
- 5.76 Ocugen Inc.
- 5.77 Ocular Therapeutix Inc.
- 5.78 Oculis Holding AG
- 5.79 InflammX Therapeutics
- 5.80 Omeros Corporation
- 5.81 Oncolys BioPharma Inc.
- 5.82 ONL Therapeutics Inc.
- 5.83 ONO Pharmaceutical Co
- 5.84 Otero Therapeutics
- 5.85 Otsuka Pharmaceutical Co.
- 5.86 Oxford BioMedica
- 5.87 Parion Sciences Inc.
- 5.88 Peregrine Ophthalmic
- 5.89 Pfizer Inc.
- 5.90 pH Pharma Co
- 5.91 Sylentis (PharmaMar)
- 5.92 Q BioMed Inc.
- 5.93 Radikal Therapeutics Inc.
- 5.94 Regeneron Pharmaceuticals Inc.
- 5.95 RegeneRx Biopharmaceuticals Inc.
- 5.96 REGENXBIO Inc.
- 5.97 Replenish Inc.
- 5.98 Roche Holding (F. Hoffmann-La Roche)
- 5.99 Santen Pharmaceutical Company
- 5.100 Seikagaku Corporation
- 5.101 Senju Pharmaceutical Company
- 5.102 SPARC (Sun Pharma Advanced Research Company)
- 5.103 Spark Therapeutics Inc.
- 5.104 STADA Arzneimittel AG
- 5.105 Stealth BioTherapeutics
- 5.106 Stemedica Cell Technologies
- 5.107 Sumitomo Pharma
- 5.108 Sun Pharma (Sun Pharmaceutical Industries)
- 5.109 Taejoon Pharm
- 5.110 Teva Pharmaceutical Industries
- 5.111 Laboratories THEA
- 5.112 TikoMed
- 5.113 Ube Industries
- 5.114 Vision Medicines Inc.
- 5.115 Wakamoto Company
- 5.116 Xbrane Biopharma
Chapter 6: Market Sizing & Forecasts
- 6.1 Global Outlook for Ophthalmic Drugs
- 6.2 Revenue by Therapeutic Area
- 6.2.1 Anti-Infectives
- 6.2.2 Allergy & Anti-Inflammatory
- 6.2.3 Dry Eye
- 6.2.4 Glaucoma
- 6.2.5 Retinal Disorders
- 6.2.6 Other Ophthalmic Disorders
- 6.3 Revenue by Route of Administration (RoA)
- 6.3.1 Topical (Eye Drops / Gels / Ointments)
- 6.3.2 Intravitreal
- 6.3.3 Sustained-Release (SR) Implants
- 6.3.4 Systemic / Others
- 6.3.5 Sub Retinal
- 6.4 Revenue by Distribution Channel
- 6.4.1 Hospital / Specialty Pharmacy
- 6.4.2 Retail Pharmacy
- 6.4.3 Online Pharmacies / D2C
- 6.5 Revenue by Drug Type
- 6.5.1 Small Molecules
- 6.5.2 Biologics
- 6.5.3 Gene & Cell Therapies
- 6.5.4 RNA Therapies
- 6.6 Revenue by Prescription Status
- 6.6.1 Prescription (RX)
- 6.6.2 Over-The-Counter (OTC)
- 6.7 Revenue by Patent Status
- 6.7.1 Originator
- 6.7.2 Generic
- 6.7.3 Biosimilar
- 6.8 Revenue by Region
- 6.8.1 Asia Pacific
- 6.8.2 Europe
- 6.8.3 Middle East & Africa
- 6.8.4 Latin & Central America
- 6.8.5 North America
- 6.9 Top Country Markets
- 6.9.1 Australia
- 6.9.2 Brazil
- 6.9.3 Canada
- 6.9.4 China
- 6.9.5 Egypt
- 6.9.6 France
- 6.9.7 Germany
- 6.9.8 Greece
- 6.9.9 India
- 6.9.10 Israel
- 6.9.11 Italy
- 6.9.12 Japan
- 6.9.13 Mexico
- 6.9.14 Netherlands
- 6.9.15 Poland
- 6.9.16 Portugal
- 6.9.17 Russia
- 6.9.18 Saudi Arabia
- 6.9.19 South Africa
- 6.9.20 South Korea
- 6.9.21 Spain
- 6.9.22 Switzerland
- 6.9.23 Taiwan
- 6.9.24 Turkey
- 6.9.25 UK
- 6.9.26 USA
Chapter 7: Conclusion & Strategic Recommendations
- 7.1 Why is the Market Poised to Grow?
- 7.2 Competitive Industry Landscape: Acquisitions, Alliances & Consolidation
- 7.3 Lower-Cost Countries: Increasing R&D and Manufacturing Investments
- 7.4 R&D Pipeline Review: Prospects of New Therapies
- 7.4.1 Long-Acting VEGF Inhibitors for Wet AMD
- 7.4.2 Dual-Inhibition Bispecifics: Beyond VEGF Monotherapy
- 7.4.3 Emerging Mechanisms for Diabetic Eye Disease
- 7.4.4 Dry AMD and Geographic Atrophy: Building Beyond the First Approvals
- 7.4.5 Sustained Release Platforms for Glaucoma
- 7.4.6 ROCK & Other Kinase Inhibitors for Glaucoma
- 7.4.7 Prostaglandin EP2, EP3 & FP Receptor Agonists
- 7.4.8 NO (Nitric Oxide) Donors
- 7.4.9 New Drug Classes for Dry Eye Disease and Others
- 7.4.10 Gene & Cell Therapies
- 7.4.11 Other Programs
- 7.5 Combination Therapy: Exploiting Multiple Mechanisms of Action
- 7.5.1 Fixed-Dose Combination Topical Therapy for Glaucoma
- 7.5.2 Bispecific Biologics: Faricimab and the Dual-Mechanism Paradigm in Retinal Disease
- 7.5.3 Complement Inhibition Combinations in Geographic Atrophy
- 7.5.4 Anti-VEGF Combined with Tyrosine Kinase Inhibitors
- 7.5.5 Gene Therapy and Pharmacological Adjuncts
- 7.5.6 Sustained-Release Dual-Payload Devices
- 7.5.7 Regulatory Considerations for Combination of Ophthalmic Products
- 7.6 Towards New Delivery Routes
- 7.6.1 Oral Delivery
- 7.6.2 Injectables
- 7.6.3 Implants
- 7.6.3.1 Surface Implants & Contact Lenses
- 7.6.3.2 Subconjunctival Implants
- 7.6.3.3 Intrascleral Implants
- 7.6.3.4 Intracameral Implants
- 7.6.3.5 Intravitreal Implants
- 7.6.4 Punctal Plugs
- 7.6.5 Eye Drops for Posterior Segment Disease
- 7.6.6 Gel-Forming Drops
- 7.6.7 Nanotechnology
- 7.6.8 Iontophoresis
- 7.6.9 High Precision Micro-Dosing
- 7.7 Improving Patient Compliance
- 7.7.1 The Trend of Treatment Discontinuation
- 7.7.2 Reducing Preservatives
- 7.8 Macro-Environmental Context: Post-Pandemic Landscape, Health System Pressures, and Digital Transformation
- 7.9 Geographic Outlook: Which Countries Offer the Highest Growth Potential?
- 7.10 Which Therapeutic Class Leads the Market?
- 7.11 Strategic Recommendations
List of Figures
- Figure 1: Common Eye Disorders
- Figure 2: Global Ophthalmic Product Spending by Submarket (%)
- Figure 3: Patent Expiration Dates for Key Innovator Ophthalmic Drugs
- Figure 4: Distribution of Ophthalmic Drugs R&D Pipeline Candidates by Therapeutic Area (%)
- Figure 5: Distribution of Ophthalmic Drugs R&D Pipeline Candidates by Mechanistic Class (%)
- Figure 6: Distribution of Ophthalmic Drugs R&D Pipeline Candidates by Category (%)
- Figure 7: Distribution of Ophthalmic Drugs R&D Pipeline Candidates by Phase (%)
- Figure 8: AMD & Retinal Disorders Drug Developmental Pipeline Candidates Table
- Figure 9: A Diabetic Eye Disease Drug Developmental Pipeline Candidates Table
- Figure 10: Dry Eye Disease Drug Developmental Pipeline Candidates Table
- Figure 11: Glaucoma & Ocular Hypertension Drug Developmental Pipeline Candidates Table
- Figure 12: Ocular Immunology Drug Developmental Pipeline Candidates Table
- Figure 13: Other Indications Drug Developmental Pipeline Candidates Table
- Figure 14: Ophthalmic Drugs Future Roadmap: 2026 - 2036
- Figure 15: Ophthalmic Drugs Value Chain
- Figure 16: Global Ophthalmic Drugs Revenue ($ Billion): 2026 - 2036
- Figure 17: Global Ophthalmic Drugs Revenue Table ($ Million): 2026 - 2036
- Figure 18: Global Ophthalmic Drugs Revenue Table by Therapeutic Area ($ Million): 2026 - 2036
- Figure 19: Global Ophthalmic Drugs Revenue by Therapeutic Area ($ Billion): 2026 - 2036
- Figure 20: Ophthalmic Anti-Infective Drugs Revenue ($ Billion): 2026 - 2036
- Figure 21: Ophthalmic Allergy & Anti-Inflammatory Drugs Revenue ($ Billion): 2026 - 2036
- Figure 22: Dry Eye Drugs Revenue ($ Billion): 2026 - 2036
- Figure 23: Glaucoma Drugs Revenue ($ Billion): 2026 - 2036
- Figure 24: Retinal Disorder Drugs Revenue ($ Billion): 2026 - 2036
- Figure 25: Other Ophthalmic Disorder Drugs Revenue ($ Billion): 2026 - 2036
- Figure 26: Global Ophthalmic Drugs Revenue Table by Route of Administration ($ Billion): 2026 - 2036
- Figure 27: Global Ophthalmic Drugs Revenue by Route of Administration ($ Billion): 2026 - 2036
- Figure 28: Topical Ophthalmic Drugs Revenue ($ Billion): 2026 - 2036
- Figure 29: Intravitreal Ophthalmic Drugs Revenue ($ Billion): 2026 - 2036
- Figure 30: Sustained-Release (SR) Implants Ophthalmic Drugs Revenue ($ Billion): 2026 - 2036
- Figure 31: Systemic / Others Ophthalmic Drugs Revenue ($ Billion): 2026 - 2036
- Figure 32: Sub Retinal Ophthalmic Drugs Revenue ($ Billion): 2026 - 2036
- Figure 33: Global Ophthalmic Drugs Revenue Table by Distribution Channel ($ Million): 2026 - 2036
- Figure 34: Global Ophthalmic Drugs Revenue by Distribution Channel ($ Billion): 2026 - 2036
- Figure 35: Hospital / Specialty Pharmacy Ophthalmic Drugs Revenue ($ Billion): 2026 - 2036
- Figure 36: Retail Pharmacy Ophthalmic Drugs Revenue ($ Billion): 2026 - 2036
- Figure 37: Online Pharmacies / D2C Ophthalmic Drugs Revenue ($ Billion): 2026 - 2036
- Figure 38: Global Ophthalmic Drugs Revenue Table by Drug Type ($ Billion): 2026 - 2036
- Figure 39: Global Ophthalmic Drugs Revenue by Drug Type ($ Billion): 2026 - 2036
- Figure 40: Small Molecule Ophthalmic Drugs Revenue ($ Billion): 2026 - 2036
- Figure 41: Biologic Ophthalmic Drugs Revenue ($ Billion): 2026 - 2036
- Figure 42: Gene & Cell Therapies Ophthalmic Drugs Revenue ($ Billion): 2026 - 2036
- Figure 43: RNA Therapies Ophthalmic Drugs Revenue ($ Billion): 2026 - 2036
- Figure 44: Global Ophthalmic Drugs Revenue Table by Prescription Status ($ Million): 2026 - 2036
- Figure 45: Global Ophthalmic Drugs Revenue by Prescription Status ($ Billion): 2026 - 2036
- Figure 46: Prescription (RX) Ophthalmic Drugs Revenue ($ Billion): 2026 - 2036
- Figure 47: Over-The-Counter (OTC) Ophthalmic Drugs Revenue ($ Billion): 2026 - 2036
- Figure 48: Global Ophthalmic Drugs Revenue Table by Patent Status ($ Million): 2026 - 2036
- Figure 49: Global Ophthalmic Drugs Revenue by Patent Status ($ Billion): 2026 - 2036
- Figure 50: Originator Ophthalmic Drugs Revenue ($ Billion): 2026 - 2036
- Figure 51: Generic Ophthalmic Drugs Revenue ($ Billion): 2026 - 2036
- Figure 52: Biosimilar Ophthalmic Drugs Revenue ($ Billion): 2026 - 2036
- Figure 53: Global Ophthalmic Drugs Revenue Table by Region ($ Million): 2026 - 2036
- Figure 54: Global Ophthalmic Drugs Revenue by Region ($ Billion): 2026 - 2036
- Figure 55: Asia Pacific Ophthalmic Drugs Revenue ($ Billion): 2026 - 2036
- Figure 56: Europe Ophthalmic Drugs Revenue ($ Billion): 2026 - 2036
- Figure 57: Middle East & Africa Ophthalmic Drugs Revenue ($ Billion): 2026 - 2036
- Figure 58: Latin & Central America Ophthalmic Drugs Revenue ($ Billion): 2026 - 2036
- Figure 59: North America Ophthalmic Drugs Revenue ($ Billion): 2026 - 2036
- Figure 60: Top 20 Ophthalmic Drugs Country Markets Table by Revenue ($ Million): 2026 - 2036
- Figure 61: Australia Ophthalmic Drugs Revenue ($ Million): 2026 - 2036
- Figure 62: Brazil Ophthalmic Drugs Revenue ($ Million): 2026 - 2036
- Figure 63: Canada Ophthalmic Drugs Revenue ($ Million): 2026 - 2036
- Figure 64: China Ophthalmic Drugs Revenue ($ Million): 2026 - 2036
- Figure 65: Egypt Ophthalmic Drugs Revenue ($ Million): 2026 - 2036
- Figure 66: France Ophthalmic Drugs Revenue ($ Million): 2026 - 2036
- Figure 67: Germany Ophthalmic Drugs Revenue ($ Million): 2026 - 2036
- Figure 68: Greece Ophthalmic Drugs Revenue ($ Million): 2026 - 2036
- Figure 69: India Ophthalmic Drugs Revenue ($ Million): 2026 - 2036
- Figure 70: Israel Ophthalmic Drugs Revenue ($ Million): 2026 - 2036
- Figure 71: Italy Ophthalmic Drugs Revenue ($ Million): 2026 - 2036
- Figure 72: Japan Ophthalmic Drugs Revenue ($ Million): 2026 - 2036
- Figure 73: Mexico Ophthalmic Drugs Revenue ($ Million): 2026 - 2036
- Figure 74: Netherlands Ophthalmic Drugs Revenue ($ Million): 2026 - 2036
- Figure 75: Poland Ophthalmic Drugs Revenue ($ Million): 2026 - 2036
- Figure 76: Portugal Ophthalmic Drugs Revenue ($ Million): 2026 - 2036
- Figure 77: Russia Ophthalmic Drugs Revenue ($ Million): 2026 - 2036
- Figure 78: Saudi Arabia Ophthalmic Drugs Revenue ($ Million): 2026 - 2036
- Figure 79: South Africa Ophthalmic Drugs Revenue ($ Million): 2026 - 2036
- Figure 80: South Korea Ophthalmic Drugs Revenue ($ Million): 2026 - 2036
- Figure 81: Spain Ophthalmic Drugs Revenue ($ Million): 2026 - 2036
- Figure 82: Switzerland Ophthalmic Drugs Revenue ($ Million): 2026 - 2036
- Figure 83: Taiwan Ophthalmic Drugs Revenue ($ Million): 2026 - 2036
- Figure 84: Turkey Ophthalmic Drugs Revenue ($ Million): 2026 - 2036
- Figure 85: UK Ophthalmic Drugs Revenue ($ Million): 2026 - 2036
- Figure 86: USA Ophthalmic Drugs Revenue ($ Million): 2026 - 2036

