PUBLISHER: Mordor Intelligence | PRODUCT CODE: 2100516

PUBLISHER: Mordor Intelligence | PRODUCT CODE: 2100516
Concentrated Solar Power (CSP) - Market Share Analysis, Industry Trends & Statistics, Growth Forecasts (2026 - 2031)
According to Mordor Intelligence, the concentrated solar power market size in terms of installed base is projected to expand from 7.29 gigawatt in 2025 and 8.15 gigawatt in 2026 to 16.25 gigawatt by 2031, registering a CAGR of 14.80% between 2026 to 2031.
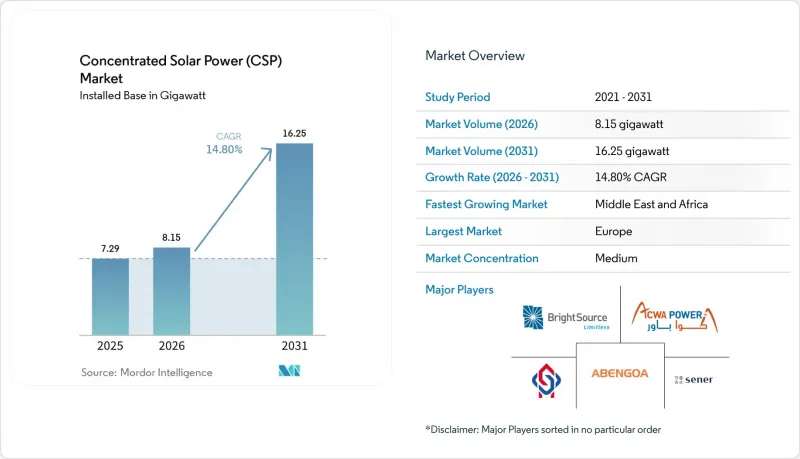
This report is Segmented by Technology (Parabolic Trough, Linear Fresnel, Power Tower, and Dish/Stirling), Heat Transfer Fluid (Molten Salt, Synthetic Oil, Direct Steam/Water, and Other Fluids), Capacity Range (Below 50 MW, 50-150 MW, and Above 150 MW), and Geography (Europe, Asia-Pacific, Middle East and Africa, and More). The Market Sizes and Forecasts are Provided in Terms of Capacity (GW).
Global Concentrated Solar Power (CSP) Market Trends and Insights
Declining LCOE for CSP With Storage
Levelized-cost curves for CSP combined with molten-salt storage fell 70% between 2010 and 2024, hitting USD 0.092 per kWh worldwide, while Chinese projects landed at USD 0.069 per kWh in late 2024. Standardized heliostat designs, local manufacturing in China and Gulf states, and auction-driven competition underpin that drop, creating a stronger economic foundation for the CSP market. Dubai's 950 MW Mohammed bin Rashid Al Maktoum Phase 4 locked a record USD 0.073 per kWh tariff in 2023, proving competitiveness against gas turbines in carbon-constrained markets. Fifteen-hour storage lets utilities defer large battery procurements. Capital markets have started to factor the lower revenue volatility into weighted-average cost of capital models, reducing required equity returns by up to 150 basis points in recent financings. Developers are now underwriting projects assuming a 5% to 7% annual capex decline through 2030, which accelerates pipeline growth in subsidy-light jurisdictions.
Grid Need for Long-Duration Dispatchable Renewables
Global transmission operators report deepening net-load ramps as solar penetration rises. California's spring 2024 "duck curve" saw a 13 GW three-hour ramp, straining reserves. Lithium-ion batteries excel at four-hour discharge but become uneconomic beyond eight hours, leaving a gap that molten-salt CSP supplies at a lower lifetime cost. CSP turbines can start in under ten minutes, offering inertia and frequency response without cycle-life degradation. Capacity-credit frameworks now assign CSP up to 85% of nameplate rating in Spain, South Africa, and Chile, compared with 30%-50% for photovoltaic-battery hybrids. As grids target 24/7 renewable portfolios, planners are increasingly embedding minimum long-duration storage quotas in resource-adequacy procurements, directly boosting the Concentrated Solar Power market.
PV + Battery Cost Declines Undercutting CSP Bids
Photovoltaic modules fell another 12% year-on-year in 2024, while lithium-ion packs are 89% cheaper than in 2010, letting four-hour hybrids clear auctions near USD 0.055 per kWh in high-irradiance markets. Australia's 2024-2025 tenders awarded no CSP, and the United States has not announced new CSP since 2020, as financiers prefer faster, proven photovoltaic projects. Unless RFPs explicitly demand eight-hour-plus discharge or carbon caps favor CSP, bid competitiveness will keep eroding near-term Concentrated Solar Power market share.
Other drivers and restraints analyzed in the detailed report include:
- MENA & China Policy Auctions Accelerating Build-Out
- Industrial Process-Heat & Green-Hydrogen Coupling
- High Upfront CAPEX & Limited Project Finance Pools
For complete list of drivers and restraints, kindly check the Table Of Contents.
Segment Analysis
The Concentrated Solar Power market size for parabolic trough systems stood at 4.86 GW in 2025, equal to 66.7% of total capacity, yet power towers are expanding at a 16.8% CAGR en route to 7.3 GW by 2031. Power towers reach 565 °C, integrate 15-hour storage, and secured 100 MW at Dubai Phase 4 in 2023. Although towers carry a 15%-20% cost premium, Spain's 2025 auctions awarded them 85% capacity credits against 70% for troughs, tilting new orders. Linear Fresnel and dish-Stirling remain niche, collectively under 3% of 2025 installations, but Fresnel arrays find traction in process-heat projects where land constraints and lower temperature needs dominate economics.
Capex learning rates favor towers as heliostat automation improves and supercritical CO2 cycles target 50% turbine efficiency by 2030. Troughs continue in hybrid retrofits that reuse turbines and balance-of-plant gear, cutting repower capex by up to 40%. Technology choice now hinges less on optical design and more on dispatch duration and storage integration, a shift that will keep the Concentrated Solar Power market diversified yet tower-weighted through the decade.
Complete Report Scope:
- By Technology
- Parabolic Trough
- Linear Fresnel
- Power Tower
- Dish/Stirling
- By Heat Transfer Fluid
- Molten Salt
- Synthetic Oil
- Direct Steam/Water
- Other Fluids (CO2, Nanofluids)
- By Capacity Range
- Below 50 MW
- 50 to 150 MW
- Above 150 MW
- By Geography
- North America
- United States
- Canada
- Mexico
- Europe
- United Kingdom
- Germany
- France
- Spain
- Nordic Countries
- Russia
- Rest of Europe
- Asia-Pacific
- China
- India
- Japan
- South Korea
- Malaysia
- Thailand
- Indonesia
- Vietnam
- Australia
- Rest of Asia-Pacific
- South America
- Brazil
- Argentina
- Colombia
- Rest of South America
- Middle East and Africa
- United Arab Emirates
- Saudi Arabia
- South Africa
- Egypt
- Rest of Middle East and Africa
- North America
Geography Analysis
Europe retained 2.34 GW of capacity in 2025, equal to 32.1% of the global base, yet growth is muted as auctions favor PV-battery hybrids. Spain's Solgest-1, a 110 MW direct-steam trough, is the only new European CSP under construction, slated for 2026 commissioning. Policy uncertainty and ample offshore wind resources in Northern Europe limit further uptake, constraining expansion opportunities in the concentrated solar power market.
The Middle East and Africa posted the fastest expansion at 22.5% CAGR. Saudi Arabia's 2.6 GW pipeline, the UAE's operating 950 MW complex, and Egypt's 600 MW tender underpin that momentum. Morocco's Noor complex proves CSP viability in North Africa, spurring feasibility studies in Tunisia and Algeria, while a 200 MW expansion at Noor was evaluated in 2024. Auction rules bundle sovereign guarantees, de-risking foreign debt, and helping the Concentrated Solar Power market grow rapidly in the region.
Asia-Pacific growth is China-centric. Operating 838 MW in 2024, China has 3.3 GW under construction and targets 15 GW by 2030, backed by provincial feed-in premiums for >=10-hour storage. India's CSP ambitions stalled after only 225 MW out of the original 500 MW Jawaharlal Nehru Mission quota reached completion, and Australia's Aurora project remains unfunded. North America's 1.7 GW legacy fleet has seen no new projects since 2014, reflecting investor preference for credit-enhanced photovoltaic storage. South America hosts only Chile's 110 MW Cerro Dominador, with subsequent CSP proposals sidelined by domestic lithium-battery manufacturing policy, highlighting regional disparities within the concentrated solar power market.
- ACWA Power
- Abengoa Solar / Atlantica
- BrightSource Energy
- SENER
- Nextera Energy
- ENGIE
- Acciona Energia
- Shouhang High-Tech
- Aalborg CSP
- TSK Flagsol
- Cobra Energia
- Bechtel
- Chiyoda Corporation
- SR Energy
- SolarReserve
- SEPCO III
- DEWA (Dubai Electricity & Water Authority)
- EDF Renewables
- China Power International Development
- Masdar
Additional Benefits:
- The market estimate (ME) sheet in Excel format
- 3 months of analyst support
TABLE OF CONTENTS
1 Introduction
- 1.1 Study Assumptions & Market Definition
- 1.2 Scope of the Study
2 Research Methodology
3 Executive Summary
4 Market Landscape
- 4.1 Market Overview
- 4.2 Market Drivers
- 4.2.1 Declining LCOE for CSP with storage
- 4.2.2 Grid need for long-duration, dispatchable renewables
- 4.2.3 MENA & China policy auctions accelerating build-out
- 4.2.4 Industrial process-heat & green-hydrogen coupling
- 4.2.5 Hybrid CSP-desalination in water-stressed regions
- 4.2.6 24/7 clean heat demand from hyperscale datacentres
- 4.3 Market Restraints
- 4.3.1 PV + battery cost declines undercutting CSP bids
- 4.3.2 High upfront CAPEX & limited project finance pools
- 4.3.3 Hitec-salt supply-chain price volatility
- 4.3.4 Cooling-water scarcity at desert project sites
- 4.4 Supply-Chain Analysis
- 4.5 Regulatory Landscape
- 4.6 Technological Outlook
- 4.7 Porter's Five Forces
- 4.7.1 Bargaining Power of Suppliers
- 4.7.2 Bargaining Power of Buyers
- 4.7.3 Threat of New Entrants
- 4.7.4 Threat of Substitutes
- 4.7.5 Competitive Rivalry
5 Market Size & Growth Forecasts
- 5.1 By Technology
- 5.1.1 Parabolic Trough
- 5.1.2 Linear Fresnel
- 5.1.3 Power Tower
- 5.1.4 Dish/Stirling
- 5.2 By Heat Transfer Fluid
- 5.2.1 Molten Salt
- 5.2.2 Synthetic Oil
- 5.2.3 Direct Steam/Water
- 5.2.4 Other Fluids (CO2, Nanofluids)
- 5.3 By Capacity Range
- 5.3.1 Below 50 MW
- 5.3.2 50 to 150 MW
- 5.3.3 Above 150 MW
- 5.4 By Geography
- 5.4.1 North America
- 5.4.1.1 United States
- 5.4.1.2 Canada
- 5.4.1.3 Mexico
- 5.4.2 Europe
- 5.4.2.1 United Kingdom
- 5.4.2.2 Germany
- 5.4.2.3 France
- 5.4.2.4 Spain
- 5.4.2.5 Nordic Countries
- 5.4.2.6 Russia
- 5.4.2.7 Rest of Europe
- 5.4.3 Asia-Pacific
- 5.4.3.1 China
- 5.4.3.2 India
- 5.4.3.3 Japan
- 5.4.3.4 South Korea
- 5.4.3.5 Malaysia
- 5.4.3.6 Thailand
- 5.4.3.7 Indonesia
- 5.4.3.8 Vietnam
- 5.4.3.9 Australia
- 5.4.3.10 Rest of Asia-Pacific
- 5.4.4 South America
- 5.4.4.1 Brazil
- 5.4.4.2 Argentina
- 5.4.4.3 Colombia
- 5.4.4.4 Rest of South America
- 5.4.5 Middle East and Africa
- 5.4.5.1 United Arab Emirates
- 5.4.5.2 Saudi Arabia
- 5.4.5.3 South Africa
- 5.4.5.4 Egypt
- 5.4.5.5 Rest of Middle East and Africa
- 5.4.1 North America
6 Competitive Landscape
- 6.1 Market Concentration
- 6.2 Strategic Moves (M&A, Partnerships, PPAs)
- 6.3 Market Share Analysis (Market Rank/Share for key companies)
- 6.4 Company Profiles (includes Global level Overview, Market level overview, Core Segments, Financials as available, Strategic Information, Products & Services, and Recent Developments)
- 6.4.1 ACWA Power
- 6.4.2 Abengoa Solar / Atlantica
- 6.4.3 BrightSource Energy
- 6.4.4 SENER
- 6.4.5 Nextera Energy
- 6.4.6 ENGIE
- 6.4.7 Acciona Energia
- 6.4.8 Shouhang High-Tech
- 6.4.9 Aalborg CSP
- 6.4.10 TSK Flagsol
- 6.4.11 Cobra Energia
- 6.4.12 Bechtel
- 6.4.13 Chiyoda Corporation
- 6.4.14 SR Energy
- 6.4.15 SolarReserve
- 6.4.16 SEPCO III
- 6.4.17 DEWA (Dubai Electricity & Water Authority)
- 6.4.18 EDF Renewables
- 6.4.19 China Power International Development
- 6.4.20 Masdar
7 Market Opportunities & Future Outlook
- 7.1 White-space & Unmet-Need Assessment

