PUBLISHER: Mordor Intelligence | PRODUCT CODE: 2100739

PUBLISHER: Mordor Intelligence | PRODUCT CODE: 2100739
India Passenger Car - Market Share Analysis, Industry Trends & Statistics, Growth Forecasts (2026 - 2031)
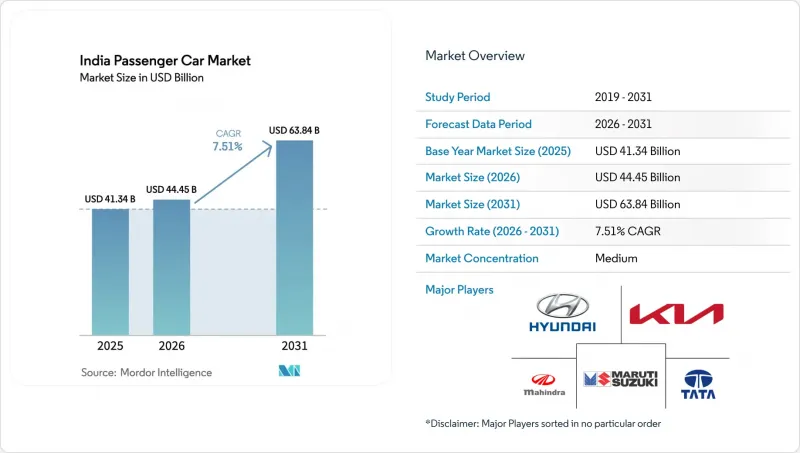
According to Mordor Intelligence, the Indian passenger car market size is expected to grow from USD 41.34 billion in 2025 to USD 44.45 billion in 2026 and is forecast to reach USD 63.84 billion by 2031 at a 7.51% CAGR over 2026-2031.
This report is Segmented by Vehicle Configuration (Hatchback, MPV, Sedan, and SUV), Propulsion Type (Hybrid & Electric and ICE), Transmission (Manual, Automatic, AMT/IMT, and DCT/CVT), Price Band (Less Than or Equal To INR 5 Lakh and More), and Ownership (Personal and Fleet). Forecasts in Value (USD) and Volume (Units).
India Passenger Car Market Trends and Insights
Surging Compact-SUV Supply From 4,000-4,400 mm Length Bracket
Lower GST-plus-cess slabs spurred several launches in the sub-4-meter SUV segment during the forecast period. Recently launched models, including Maruti Fronx, Hyundai Exter, Tata Punch, Mahindra XUV 3XO, and Kia Sonet, collectively achieved significant sales volumes, with each benefiting from notable tax savings . Mahindra's XUV 3XO, highlighting the strong demand for feature-rich compact SUVs, received an overwhelming number of reservations shortly after its launch. While shared architectures, such as Hyundai's K1 and Maruti's Heartect, spread tooling costs across various models, this clustering heightened price competition. As brands offered bundled accessories and extended warranties to manage rising inventories, transaction prices in the mid-range segment experienced a slight decline.
CNG Infrastructure Build-Out Reducing Running-Cost Parity Time
Between early 2024 and late 2025, the number of CNG outlets experienced significant growth, offering a notable cost advantage over gasoline prices at urban pumps. For regular users, the payback period for factory-fitted CNG cars has become considerably shorter. This trend has driven Maruti to achieve substantial CNG sales across multiple models . Meanwhile, Hyundai and Tata have expanded their offerings by introducing CNG options in several models. Looking ahead, regulators have set ambitious targets for station expansion by the end of the decade. However, challenges persist: trade-offs like reduced boot space and slight power reductions have limited CNG adoption to a fraction of total volumes.
Dealer Inventory Overhang More Than 50 Days Pressuring OEM Production
Channel stock increased significantly, exceeding the usual levels, which resulted in a substantial number of unsold units. To address this issue, Maruti reduced its January 2026 production by a notable percentage. At the same time, Hyundai and Tata implemented measures to support dealer liquidity by extending floor-plan tenures, which led to additional interest expenses per car. Throughout 2025, the Reserve Bank of India maintained the repo rate at a steady level, keeping auto-loan rates relatively high and suppressing festive demand. During the last quarter of 2025, significant discounting caused a noticeable decline in OEM gross margins.
Other drivers and restraints analyzed in the detailed report include:
- Digital-First Aspirational Younger Buyers
- E-Commerce-Fuelled Urban Gig-Fleet Demand
- Intensifying Price War in Entry Hatchbacks Squeezing Margins
For complete list of drivers and restraints, kindly check the Table Of Contents.
Segment Analysis
Sports Utility Vehicles controlled 53.47% of 2025 deliveries within the Indian passenger car market size and should advance at a 7.53% trajectory to 2031. Sub-4-meter SUVs like the Maruti Fronx, Hyundai Exter, and Tata Punch benefit from a reduced GST-plus-cess slab. This tax break significantly lowers ownership costs over the vehicle's lifecycle, making these SUVs more accessible to aspirational households. Mahindra's Scorpio-N and XUV700 have demonstrated strong demand, highlighting the appeal of rear-wheel-drive and 4x4 features in the premium segment. Meanwhile, hatchbacks have seen a decline in market share, reflecting a trend of first-time buyers shifting towards SUVs. Sedans have maintained a stable presence, supported by consistent fleet demand for the Maruti Dzire, while multi-purpose vehicles continue to address the mobility needs of joint families, particularly in rural areas.
The surge in SUV popularity has led to shared platforms; Hyundai's K1 platform now underpins multiple models, achieving significant reductions in per-unit R&D costs. Maruti's Heartect platform, enabling flexible model transitions, has enhanced production efficiency at its Gujarat plant. In this competitive landscape, the performance of models like the Nissan Magnite and Renault Kiger underscores the importance of service accessibility over product differentiation. Furthermore, innovative body styles, such as Tata's Curvv EV coupe, which has attracted considerable consumer interest, indicate potential growth opportunities even as the segment matures.
Internal Combustion Engines kept 83.35% command in 2025; however, EVs are slated to record a 7.61% CAGR through 2031, aided by substantial PM E-DRIVE demand incentives. Tata Motors dominated the EV market, accounting for a significant share of sales with strong performance across its Nexon EV, Tiago EV, and Punch EV models. By strategically pricing these models in the affordable range, Tata Motors successfully broadened its market reach. In contrast, Hyundai's Ioniq 5 and Kia's EV6, positioned in the premium price segment, managed to capture only a limited volume. Among internal combustion engine (ICE) vehicles, gasoline remained the most preferred choice, followed by diesel, while CNG gained notable traction due to Maruti's bi-fuel offerings. This highlights the varied choices available to consumers.
The hybrid segment experienced notable growth, led by the Toyota Hyryder, which offers significant fuel efficiency improvements compared to gasoline and benefits from favorable tax rates. However, plug-in hybrids and fuel-cell vehicles have struggled to gain traction, hindered by their high initial costs and limited infrastructure. While clear policies on future emission standards will shape medium-term investment decisions in propulsion technologies, the current resilience of ICE vehicles suggests a gradual transition rather than a sudden shift.
Complete Report Scope:
- By Vehicle Configuration
- Hatchback
- Multi-Purpose Vehicle
- Sedan
- Sports Utility Vehicle
- By Propulsion Type
- Hybrid & Electric Vehicles
- Battery Electric
- Hybrid Electric
- Plug-in Hybrid Electric
- Fuel-cell Electric
- Internal Combustion Engine (ICE)
- CNG
- Diesel
- Gasoline
- LPG
- Hybrid & Electric Vehicles
- By Transmission Type
- Manual
- Automatic (Torque-Converter)
- Automated-Manual / iMT
- Dual-Clutch / CVT
- By Price Band
- Less than or equal to INR 5 lakh
- INR 5-10 lakh
- INR 10-20 lakh
- More than INR 20 lakh
- By Ownership Model
- Personal
- Fleet (Ride-hailing, Subscription, Leasing)
List of Companies Covered in this Report:
- Maruti Suzuki India Limited
- Hyundai Motor India Limited
- Tata Motors Limited
- Mahindra & Mahindra Limited
- Kia Corporation
- Toyota Kirloskar Motor Pvt. Ltd.
- Honda Cars India Ltd.
- MG Motor India Pvt. Ltd.
- Renault India Pvt. Ltd.
- Nissan Motor India Pvt. Ltd.
- Volkswagen AG
- BYD India Pvt. Ltd.
- Audi AG
- BMW India Pvt. Ltd.
Additional Benefits:
- The market estimate (ME) sheet in Excel format
- 3 months of analyst support
TABLE OF CONTENTS
1 Introduction
- 1.1 Study Assumptions & Market Definition
- 1.2 Scope of the Study
2 Research Methodology
3 Executive Summary
4 Key Industry Trend
- 4.1 Urbanization, Population & Vehicle/Transit Demand
- 4.2 Car Ownership & Motorization Rate
- 4.3 EV Penetration in Car Market
- 4.4 Fuel vs Electricity Price Spread (Per km, ICE vs EV)
- 4.5 EV vs ICE Total Cost of Ownership (TCO) Gap
- 4.6 Financing & Ownership Models (Loans, Leasing, Subscription)
- 4.7 Battery Chemistry Mix & Pack Energy Density (LFP vs NMC etc.)
- 4.8 Home, Workplace & Public Charger Access / Density
- 4.9 Fast-Charging Network Coverage & Power Bands
- 4.10 Alternative Fuels Infrastructure (Hydrogen for FCEVs)
- 4.11 Subsidy & Consumer Incentive Value (Purchase, Tax, Toll/Parking Benefits)
- 4.12 OEM EV Line-up & Model Pipeline
- 4.13 Value-Chain & Distribution-Channel Analysis
- 4.14 Regulatory, Fiscal & Industrial Policy Framework
5 Market Landscape
- 5.1 Market Overview
- 5.2 Market Drivers
- 5.2.1 Surging Compact-SUV Supply From 4000-4400 Mm Length Bracket
- 5.2.2 CNG Infrastructure Build-Out Reducing Running-Cost Parity Time
- 5.2.3 Digital-First Aspirational Younger Buyers
- 5.2.4 E-Commerce-Fuelled Urban Gig-Fleet Demand
- 5.2.5 OEMs Leveraging India as Global Small-Car Export Hub
- 5.2.6 In-House Software-Defined-Vehicle Stacks Lowering Model-Cycle Time
- 5.3 Market Restraints
- 5.3.1 Dealer Inventory Overhang More Than 50 Days Pressuring OEM Production
- 5.3.2 Intensifying Price War in Entry Hatchbacks Squeezing Margins
- 5.3.3 Long-Tail Chip Shortages in Body-Control & ADAS ECUS
- 5.3.4 Patchy Fast-Charger Uptime Outside Tier-1 Cities
- 5.4 Value / Supply-Chain Analysis
- 5.5 Regulatory Landscape
- 5.6 Technological Outlook
- 5.7 Porter's Five Forces
- 5.7.1 Threat of New Entrants
- 5.7.2 Bargaining Power of Suppliers
- 5.7.3 Bargaining Power of Buyers
- 5.7.4 Threat of Substitutes
- 5.7.5 Competitive Rivalry
6 Market Size & Growth Forecasts (Value (USD) and Volume (Units))
- 6.1 By Vehicle Configuration
- 6.1.1 Hatchback
- 6.1.2 Multi-Purpose Vehicle
- 6.1.3 Sedan
- 6.1.4 Sports Utility Vehicle
- 6.2 By Propulsion Type
- 6.2.1 Hybrid & Electric Vehicles
- 6.2.1.1 Battery Electric
- 6.2.1.2 Hybrid Electric
- 6.2.1.3 Plug-in Hybrid Electric
- 6.2.1.4 Fuel-cell Electric
- 6.2.2 Internal Combustion Engine (ICE)
- 6.2.2.1 CNG
- 6.2.2.2 Diesel
- 6.2.2.3 Gasoline
- 6.2.2.4 LPG
- 6.2.1 Hybrid & Electric Vehicles
- 6.3 By Transmission Type
- 6.3.1 Manual
- 6.3.2 Automatic (Torque-Converter)
- 6.3.3 Automated-Manual / iMT
- 6.3.4 Dual-Clutch / CVT
- 6.4 By Price Band
- 6.4.1 Less than or equal to INR 5 lakh
- 6.4.2 INR 5-10 lakh
- 6.4.3 INR 10-20 lakh
- 6.4.4 More than INR 20 lakh
- 6.5 By Ownership Model
- 6.5.1 Personal
- 6.5.2 Fleet (Ride-hailing, Subscription, Leasing)
7 Competitive Landscape
- 7.1 Strategic Moves
- 7.2 Market Share Analysis
- 7.3 Company Profiles (includes Global Level Overview, Market Level Overview, Core Segments, Financials as Available, Strategic Information, Market Rank/Share for Key Companies, Products and Services, SWOT Analysis, and Recent Developments)
- 7.3.1 Maruti Suzuki India Limited
- 7.3.2 Hyundai Motor India Limited
- 7.3.3 Tata Motors Limited
- 7.3.4 Mahindra & Mahindra Limited
- 7.3.5 Kia Corporation
- 7.3.6 Toyota Kirloskar Motor Pvt. Ltd.
- 7.3.7 Honda Cars India Ltd.
- 7.3.8 MG Motor India Pvt. Ltd.
- 7.3.9 Renault India Pvt. Ltd.
- 7.3.10 Nissan Motor India Pvt. Ltd.
- 7.3.11 Volkswagen AG
- 7.3.12 BYD India Pvt. Ltd.
- 7.3.13 Audi AG
- 7.3.14 BMW India Pvt. Ltd.
8 Market Opportunities & Future Outlook
- 8.1 White-space & Unmet-need Assessment
9 Appendix
- 9.1 Global Overview
- 9.2 Porter's Five Forces Framework (Global)
- 9.3 Global Value-Chain Analysis
- 9.4 Market Dynamics (DROs)
- 9.5 Sources & References
- 9.6 List of Tables & Figures
- 9.7 Primary Insights
- 9.8 Data Pack
- 9.9 Glossary of Terms
10 Key Strategic Questions for CEOs

