PUBLISHER: Mordor Intelligence | PRODUCT CODE: 2113421

PUBLISHER: Mordor Intelligence | PRODUCT CODE: 2113421
Floating Production Systems (FPS) - Market Share Analysis, Industry Trends & Statistics, Growth Forecasts (2026 - 2031)
According to Mordor Intelligence, the floating production systems market size was valued at USD 66.60 billion in 2025 and estimated to grow from USD 73.21 billion in 2026 to reach USD 117.35 billion by 2031, at a CAGR of 9.92% during the forecast period (2026-2031).
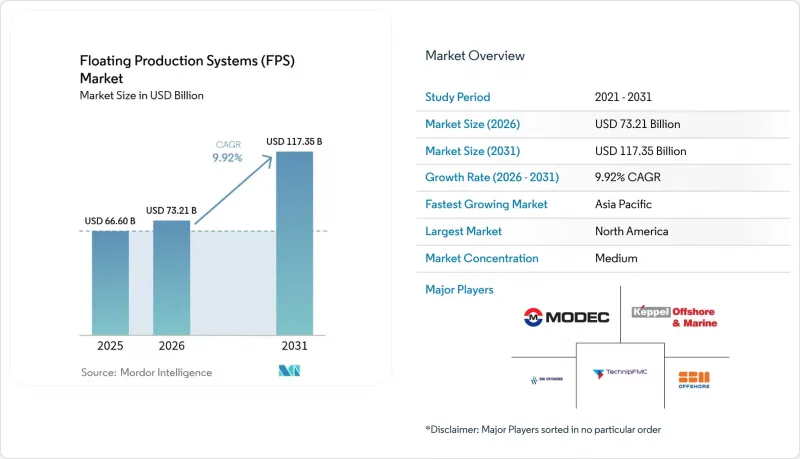
This report is Segmented by Type (FPSO, Tension Leg Platform, SPAR, Semi-Submersible, and Barge), Water Depth (Shallow Water, Deepwater, and Ultra-Deepwater), Build Method (Newbuild and Conversion), and Geography (North America, Europe, Asia-Pacific, South America, and Middle East and Africa). The Market Sizes and Forecasts are Provided in Terms of Value (USD).
Global Floating Production Systems (FPS) Market Trends and Insights
Rising Deep-water Exploration Investments
Capital is moving rapidly into deep and ultra-deepwater acreage as operators chase high-impact discoveries outside legacy provinces. ExxonMobil's fourth FPSO in Guyana lifts the country's installed capacity toward 900,000 b/d and underscores investor confidence in ultra-deep finds that remain profitable at mid-cycle oil prices. Chevron's Anchor and BP's Kaskida developments utilize a 20 kpsi subsea architecture to deliver Paleogene barrels that conventional equipment could not unlock. TotalEnergies' Kaminho project in Angola demonstrates that African frontiers can now absorb multi-billion-dollar floating investments without relying on fixed platforms. Collectively, these programs illustrate how technology maturity, robust reservoir productivity, and fiscal incentives are sustaining a pipeline of new build contracts for the floating production systems market.
Declining Shallow-water Reserves Shifting Production Offshore
Reservoir depletion across the North Sea and other shelf provinces is pushing operators to re-platform toward deeper turbidite plays where only floating concepts are technically feasible. Equinor's NOK 10 billion life extension of Oseberg leverages electrification to extend plateau production beyond 2040, while freeing fixed-platform budgets for deeper targets nearby. Gulf of Mexico incumbents mirror this strategy: the Whale semi-submersible began pumping in January 2025 with a 100,000 b/d capacity, replacing output from legacy topsides that were approaching decommissioning. The consequence is a structural rise in demand for hulls, mooring lines, and subsea systems that can be redirected to new reservoirs once primary leases decline, thereby reinforcing the attractiveness of redeployable FPSOs.
Crude-oil Price Volatility
Floating developments are capital-intensive and rely on multi-year payback horizons so that rapid oil-price swings can freeze final investment decisions. Operators paused several Gulf of Mexico tie-backs in late 2024 when benchmark prices dipped below USD 70/bbl, and rig utilization slid five percentage points in tandem. While integrated majors can hedge, independents often defer sanctioning until strip prices stabilize, creating a lumpy ordering pattern for hull fabricators. The counterweight is that the floating production systems market now benefits from lower structural breakevens-many deepwater projects operate profitably at USD 45-50/bbl after standardization and digital optimization-softening the impact of short-term price shocks.
Other drivers and restraints analyzed in the detailed report include:
- Advances in FPSO Conversion Technologies
- Energy-security Push by Emerging Economies
- High CAPEX & OPEX Requirements
For complete list of drivers and restraints, kindly check the Table Of Contents.
Segment Analysis
The floating production systems market size for FPSO units stood at USD 36.03 billion in 2025 and, supported by a 10.12% CAGR, is set to nearly double by 2031. FPSOs perform well in cyclonic basins, can be relocated as field economics evolve, and integrate topside processing for 225,000 b/d or more, as evidenced by SBM's Almirante Tamandare unit off Brazil. Tension-leg platforms continue to serve slender ultra-deep targets where heave suppression is vital, while SPARs and semi-subs retain roles in harsh-environment drilling and early production testing. The market's environmental pivot is most visible in FPSOs that bundle CO2-stripping columns and shore-power readiness, technologies that are harder to retrofit on legacy semi-subs or barges.
Second-generation FPSOs are utilizing digital twins to predict equipment fatigue, optimize gas-lift allocation, and schedule maintenance, resulting in uptime exceeding 96%. These improvements underpin the segment's leading growth within the floating production systems market and encourage financiers to treat FPSO revenue streams as quasi-infrastructure. Niche hull classes, such as barges, retain strategic importance for shallow Asian deltas, but their growth potential is capped by water-depth limits. Overall, FPSOs will continue ruling both absolute revenue and incremental demand as operators seek flexible, low-staffed solutions that align with emerging decarbonization mandates.
Complete Report Scope:
- By Type
- FPSO
- Tension Leg Platform
- SPAR
- Semi-submersible
- Barge
- By Water Depth
- Shallow Water (Below 400 m)
- Deepwater (400 to 1,500 m)
- Ultra-deepwater (Above 1,500 m)
- By Build Method
- Newbuild
- Conversion
- By Geography
- North America
- United States
- Canada
- Mexico
- Europe
- Germany
- United Kingdom
- Norway
- Russia
- Rest of Europe
- Asia-Pacific
- China
- India
- Thailand
- Vietnam
- Australia
- Rest of Asia-Pacific
- South America
- Brazil
- Trinidad and Tobago
- Rest of South America
- Middle East and Africa
- Saudi Arabia
- United Arab Emirates
- Qatar
- Egypt
- Nigeria
- Angola
- Namibia
- Rest of Middle East and Africa
- North America
Geography Analysis
North America retained a 38.30% revenue share in 2025, anchored by the Gulf of Mexico, where the U.S. Energy Information Administration projects stable offshore oil output of 1.80 million barrels per day (b/d) for 2025. Discoveries, such as Ballymore and Swordfish, leverage existing pipeline hubs, and regulatory certainty fosters a steady backlog of tie-backs that favor mid-sized FPSOs. Mexico's deepwater Salina Basin, although still at the appraisal stage, promises upside once fiscal incentives mature. Canada's Bay du Nord is the country's first floater-ready prospect and, should it proceed, will extend regional fabrication capacity beyond Newfoundland yard upgrades.
Asia-Pacific is the fastest-growing territory, recording an 11.18% CAGR to 2031 as China, Indonesia, and Australia prioritize domestic hydrocarbons. CNOOC's record discovery success keeps shipyards busy, and Chinese contractors have launched the world's first carbon-capture-equipped FPSO to underpin national climate goals while boosting liquids output. Indonesia's reformed production-sharing contracts are designed for the rapid monetization of frontier blocks off East Kalimantan, where lease-and-operate FPSOs offer the most feasible evacuation route. Meanwhile, Korea and Japan strengthen regional competitiveness by supplying high-end topside modules, dynamic positioning thrusters, and cryogenic equipment to neighboring markets.
Europe's share is stable but relatively low-growth, limited by the maturity of the North Sea. Nevertheless, the United Kingdom's electrified West of Shetland tie-backs and Norway's power-from-shore initiatives sustain a niche cluster of high-specification floaters equipped for low-carbon operations. Further south, Mediterranean deepwater acreage off Cyprus and Israel is at pre-FID stage and could lift orders later in the decade. Russia's Arctic FPSO ambitions pause under geopolitical constraints, redirecting European engineering capacity toward African mega-projects and Brazilian pre-salt campaigns. Overall, geographic diversification cushions the floating production systems market from cyclical swings in any single basin.
- SBM Offshore N.V.
- MODEC Inc.
- BW Offshore Ltd
- Keppel Offshore & Marine Ltd
- Samsung Heavy Industries Co. Ltd
- Bumi Armada Berhad
- TechnipFMC plc
- Hyundai Heavy Industries Co. Ltd
- Mitsubishi Heavy Industries Ltd
- Teekay Corporation
- Sembcorp Marine Ltd
- Offshore Oil Engineering Co. (CNOOC)
- COSCO Shipyard Group Co.
- Daewoo Shipbuilding & Marine Engineering Co. Ltd
- Aker Solutions ASA
- Petrofac Ltd
- China Harbor Engineering Co. Ltd
- Yinson Holdings Berhad
- Saipem S.p.A.
- Wood Group PLC
Additional Benefits:
- The market estimate (ME) sheet in Excel format
- 3 months of analyst support
TABLE OF CONTENTS
1 Introduction
- 1.1 Study Assumptions & Market Definition
- 1.2 Scope of the Study
2 Research Methodology
3 Executive Summary
4 Market Landscape
- 4.1 Market Overview
- 4.2 Offshore Active Rig Count
- 4.3 Market Drivers
- 4.3.1 Rising deep-water exploration investments
- 4.3.2 Declining shallow-water reserves shifting production offshore
- 4.3.3 Advances in FPSO conversion technologies
- 4.3.4 Energy-security push by emerging economies
- 4.3.5 Surge in marginal-field leasing models
- 4.3.6 Electrification of topsides lowering OPEX
- 4.4 Market Restraints
- 4.4.1 Crude-oil price volatility
- 4.4.2 High CAPEX & OPEX requirements
- 4.4.3 Limited mega-hull shipyard capacity
- 4.4.4 ESG-linked financing constraints
- 4.5 Supply-Chain Analysis
- 4.6 Regulatory Landscape
- 4.7 Technological Outlook
- 4.8 Porter's Five Forces
- 4.8.1 Bargaining Power of Suppliers
- 4.8.2 Bargaining Power of Consumers
- 4.8.3 Threat of New Entrants
- 4.8.4 Threat of Substitutes
- 4.8.5 Intensity of Competitive Rivalry
5 Market Size & Growth Forecasts
- 5.1 By Type
- 5.1.1 FPSO
- 5.1.2 Tension Leg Platform
- 5.1.3 SPAR
- 5.1.4 Semi-submersible
- 5.1.5 Barge
- 5.2 By Water Depth
- 5.2.1 Shallow Water (Below 400 m)
- 5.2.2 Deepwater (400 to 1,500 m)
- 5.2.3 Ultra-deepwater (Above 1,500 m)
- 5.3 By Build Method
- 5.3.1 Newbuild
- 5.3.2 Conversion
- 5.4 By Geography
- 5.4.1 North America
- 5.4.1.1 United States
- 5.4.1.2 Canada
- 5.4.1.3 Mexico
- 5.4.2 Europe
- 5.4.2.1 Germany
- 5.4.2.2 United Kingdom
- 5.4.2.3 Norway
- 5.4.2.4 Russia
- 5.4.2.5 Rest of Europe
- 5.4.3 Asia-Pacific
- 5.4.3.1 China
- 5.4.3.2 India
- 5.4.3.3 Thailand
- 5.4.3.4 Vietnam
- 5.4.3.5 Australia
- 5.4.3.6 Rest of Asia-Pacific
- 5.4.4 South America
- 5.4.4.1 Brazil
- 5.4.4.2 Trinidad and Tobago
- 5.4.4.3 Rest of South America
- 5.4.5 Middle East and Africa
- 5.4.5.1 Saudi Arabia
- 5.4.5.2 United Arab Emirates
- 5.4.5.3 Qatar
- 5.4.5.4 Egypt
- 5.4.5.5 Nigeria
- 5.4.5.6 Angola
- 5.4.5.7 Namibia
- 5.4.5.8 Rest of Middle East and Africa
- 5.4.1 North America
6 Competitive Landscape
- 6.1 Market Concentration
- 6.2 Strategic Moves (M&A, Partnerships, PPAs)
- 6.3 Market Share Analysis (Market Rank/Share for key companies)
- 6.4 Company Profiles (includes Global level Overview, Market level overview, Core Segments, Financials as available, Strategic Information, Products & Services, and Recent Developments)
- 6.4.1 SBM Offshore N.V.
- 6.4.2 MODEC Inc.
- 6.4.3 BW Offshore Ltd
- 6.4.4 Keppel Offshore & Marine Ltd
- 6.4.5 Samsung Heavy Industries Co. Ltd
- 6.4.6 Bumi Armada Berhad
- 6.4.7 TechnipFMC plc
- 6.4.8 Hyundai Heavy Industries Co. Ltd
- 6.4.9 Mitsubishi Heavy Industries Ltd
- 6.4.10 Teekay Corporation
- 6.4.11 Sembcorp Marine Ltd
- 6.4.12 Offshore Oil Engineering Co. (CNOOC)
- 6.4.13 COSCO Shipyard Group Co.
- 6.4.14 Daewoo Shipbuilding & Marine Engineering Co. Ltd
- 6.4.15 Aker Solutions ASA
- 6.4.16 Petrofac Ltd
- 6.4.17 China Harbor Engineering Co. Ltd
- 6.4.18 Yinson Holdings Berhad
- 6.4.19 Saipem S.p.A.
- 6.4.20 Wood Group PLC
7 Market Opportunities & Future Outlook
- 7.1 White-space & Unmet-Need Assessment

