PUBLISHER: Mordor Intelligence | PRODUCT CODE: 2113520

PUBLISHER: Mordor Intelligence | PRODUCT CODE: 2113520
GCC Fertilizer - Market Share Analysis, Industry Trends & Statistics, Growth Forecasts (2026 - 2031)
According to Mordor Intelligence, the GCC fertilizer market size is expected to grow from USD 13.0 billion in 2025 to USD 13.53 billion in 2026 and is forecast to reach USD 16.53 billion by 2031 at 4.06% CAGR over 2026-2031.
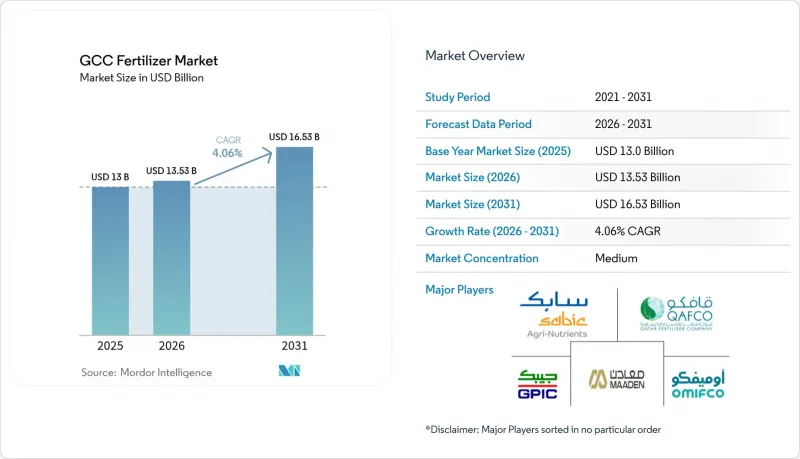
This report is Segmented by Product Type (Nitrogenous, Phosphatic, Potassic, Secondary Nutrient Fertilizers, and Micronutrient Fertilizers), by Application (Grains and Cereals, Pulses and Oil Seeds, Fruits and Vegetables, Commercial Crops, and Turfs and Ornamentals), and by Geography (Saudi Arabia, United Arab Emirates, Qatar, Oman, and More). The Market Forecasts are Provided in Terms of Value (USD).
GCC Fertilizer Market Trends and Insights
Rising Global Food Security Pressure
Heightened concerns over food availability keep the GCC fertilizer market tightly linked to the procurement cycles of large importing countries. India's postponed tenders in early 2024 prompted temporary price softness, but demand rebounded when Brazil booked USD 530.4 million of Qatari urea later in the year, underscoring the region's importance in stabilizing global grain supplies. Importers rely on consistent GCC output to safeguard wheat, rice, and maize harvests that feed nearly 3 billion people, pushing exporters to maintain robust shipment schedules even during price troughs. Saudi exporters plan to increase urea export volumes between 2019 and 2026 through long-term supply contracts that protect buyers from supply disruptions. Higher baseline consumption supports healthy utilization rates across regional plants and incentivizes further capacity additions in nitrogen and specialty blends.
Expansion of Natural-Gas-Based Ammonia Capacity in GCC
Low-cost gas remains the competitive bedrock of the GCC fertilizer market. In 2024, SABIC Agri-Nutrients secured feedstock for a 1.2 million metric tons-per-year blue-ammonia project in Jubail, while Ta'ziz in the United Arab Emirates allotted USD 2 billion to build infrastructure capable of exporting 1 million metric tons of low-carbon ammonia by 2027. Qatar's Qafco-7 unit, set to start in 2026, reinforces the country's nitrogen leadership through a QR 10.8 billion (USD 2.97 billion) five-year investment plan. Although spot ammonia prices softened to USD 400-420 per metric ton in late 2024, GCC producers with integrated gas supply maintain margin resilience and stand ready to displace higher-cost peers when prices tighten again. Consolidation remains likely because scale and energy efficiency determine long-run survival.
Volatility in Natural-Gas Feedstock Prices
Despite privileged access to associated gas, regional producers are not immune to global price gyrations that tighten spreads and erode EBITDA. Fertiglobe's H1 2024 earnings fell as higher gas transfer costs compressed margins, even though revenue topped USD 1 billion. A drop in ammonia spot prices to USD 400 per metric tons forced smaller plants to curtail output, exposing a structural divide between integrated giants and merchant operators. Saudi Aramco's upstream dominance cushions domestic suppliers, but subsidy outlays escalate when international benchmarks spike. Persistent volatility complicates capital-planning cycles for brownfield debottlenecking across the GCC fertilizer market.
Other drivers and restraints analyzed in the detailed report include:
- Government Subsidies for Export-Oriented Production
- Blue and Green Ammonia Export Hubs Enabling Premium Pricing
- Stringent Global Environmental Regulations on Nitrogen Runoff
For complete list of drivers and restraints, kindly check the Table Of Contents.
Segment Analysis
Nitrogenous fertilizers captured 47.92% of the GCC fertilizer market share in 2025, underlining feedstock-driven cost leadership and entrenched export corridors into Asia. In contrast, phosphatic volumes grow more modestly as Ma'aden's USD 921 million Phosphate 3 plant elevates nameplate capacity by 3 million metric tons per year. Potassic imports into Oman, valued at USD 9.63 million, highlight regional supply gaps that encourage intra-GCC trade to balance nutrient portfolios.
Micronutrient fertilizers are projected to expand at an 7.78% CAGR, the fastest among all products, spurred by research that shows zinc-enriched NPK regimes can raise wheat yields in arid soils. Specialty producers utilize digital soil mapping to pinpoint deficiency clusters, enabling targeted blends that command price premiums compared to bulk commodities. Ma'aden, Yara, and private Omani mixers scale chelated-iron and boron products to serve high-value horticulture in the UAE's greenhouse complexes. Higher gross margins in micronutrients offset smaller tons, reinforcing their strategic importance within the GCC fertilizer market.
Complete Report Scope:
- By Product Type
- Nitrogenous
- Urea
- Ammonium Nitrate
- Ammonium Sulfate
- Ammonia
- Calcium Ammonium Nitrate (CAN)
- Other Nitrogenous Fertilizers
- Phosphatic
- Mono-ammonium Phosphate (MAP)
- Di-ammonium Phosphate (DAP)
- Triple Superphosphate (TSP)
- Other Phosphatic Fertilizers
- Potassic
- Muriate of Potash (MOP)
- Sulfate of Potash (SOP)
- Secondary Nutrient Fertilizers
- Micronutrient Fertilizers
- Nitrogenous
- By Application
- Grains and Cereals
- Pulses and Oil Seeds
- Fruits and Vegetables
- Commercial Crops
- Turfs and Ornamentals
- By Country
- Saudi Arabia
- United Arab Emirates
- Qatar
- Oman
- Kuwait
- Bahrain
List of Companies Covered in this Report:
- SABIC Agri-Nutrients (Saudi Basic Industries Corporation)
- Qatar Fertilizer Company
- Saudi Arabian Mining Company -Ma'aden
- MITSUI & Co., Ltd. (Mitsui Group)
- Oman Indian Fertilizer Company (OMIFCO)
- Gulf Petrochemical Industries Company (B.S.C.)
- RNZ International FZCO (RNZ Group)
- Desert Oasis Fertilizers Packaging LLC (Desert Group)
- Yara International ASA
- Sohar Sulphur Fertilizers LLC
- Haifa Group
- ICL Group Ltd.
- Gulf Petrochemical Industries Company
- MAPCO Fertilizer Industries FZE
- Union Chemicals Co. LLC
Additional Benefits:
- The market estimate (ME) sheet in Excel format
- 3 months of analyst support
TABLE OF CONTENTS
1 Introduction
- 1.1 Study Assumptions and Market Definition
- 1.2 Scope of the Study
2 Research Methodology
3 Executive Summary
4 Market Landscape
- 4.1 Market Overview
- 4.2 Market Drivers
- 4.2.1 Rising global food security pressure
- 4.2.2 Expansion of natural-gas based ammonia capacity in GCC
- 4.2.3 Government subsidies for export-oriented production
- 4.2.4 Blue/green ammonia export hubs enabling premium pricing
- 4.2.5 Carbon-capture mandates driving demand for low-carbon urea
- 4.2.6 Digital agronomy platforms boosting localized fertilizer usage
- 4.3 Market Restraints
- 4.3.1 Volatility in natural-gas feedstock prices
- 4.3.2 Stringent global environmental regulations on nitrogen runoff
- 4.3.3 Shipping bottlenecks at Arabian Gulf ports
- 4.3.4 Accelerating adoption of crop nutrition alternatives
- 4.4 Regulatory Landscape
- 4.5 Technological Outlook
- 4.6 Porter's Five Forces Analysis
- 4.6.1 Threat of New Entrants
- 4.6.2 Bargaining Power of Buyers
- 4.6.3 Bargaining Power of Suppliers
- 4.6.4 Threat of Substitutes
- 4.6.5 Intensity of Competitive Rivalry
5 Market Size and Growth Forecasts (Value)
- 5.1 By Product Type
- 5.1.1 Nitrogenous
- 5.1.1.1 Urea
- 5.1.1.2 Ammonium Nitrate
- 5.1.1.3 Ammonium Sulfate
- 5.1.1.4 Ammonia
- 5.1.1.5 Calcium Ammonium Nitrate (CAN)
- 5.1.1.6 Other Nitrogenous Fertilizers
- 5.1.2 Phosphatic
- 5.1.2.1 Mono-ammonium Phosphate (MAP)
- 5.1.2.2 Di-ammonium Phosphate (DAP)
- 5.1.2.3 Triple Superphosphate (TSP)
- 5.1.2.4 Other Phosphatic Fertilizers
- 5.1.3 Potassic
- 5.1.3.1 Muriate of Potash (MOP)
- 5.1.3.2 Sulfate of Potash (SOP)
- 5.1.4 Secondary Nutrient Fertilizers
- 5.1.5 Micronutrient Fertilizers
- 5.1.1 Nitrogenous
- 5.2 By Application
- 5.2.1 Grains and Cereals
- 5.2.2 Pulses and Oil Seeds
- 5.2.3 Fruits and Vegetables
- 5.2.4 Commercial Crops
- 5.2.5 Turfs and Ornamentals
- 5.3 By Country
- 5.3.1 Saudi Arabia
- 5.3.2 United Arab Emirates
- 5.3.3 Qatar
- 5.3.4 Oman
- 5.3.5 Kuwait
- 5.3.6 Bahrain
6 Competitive Landscape
- 6.1 Market Concentration
- 6.2 Strategic Moves
- 6.3 Market Share Analysis
- 6.4 Company Profiles (Includes Global level Overview, Market level overview, Core Segments, Financials as available, Strategic Information, Market Rank/Share for key companies, Products and Services, and Recent Developments)
- 6.4.1 SABIC Agri-Nutrients (Saudi Basic Industries Corporation)
- 6.4.2 Qatar Fertilizer Company
- 6.4.3 Saudi Arabian Mining Company -Ma'aden
- 6.4.4 MITSUI & Co., Ltd. (Mitsui Group)
- 6.4.5 Oman Indian Fertilizer Company (OMIFCO)
- 6.4.6 Gulf Petrochemical Industries Company (B.S.C.)
- 6.4.7 RNZ International FZCO (RNZ Group)
- 6.4.8 Desert Oasis Fertilizers Packaging LLC (Desert Group)
- 6.4.9 Yara International ASA
- 6.4.10 Sohar Sulphur Fertilizers LLC
- 6.4.11 Haifa Group
- 6.4.12 ICL Group Ltd.
- 6.4.13 Gulf Petrochemical Industries Company
- 6.4.14 MAPCO Fertilizer Industries FZE
- 6.4.15 Union Chemicals Co. LLC
7 Market Opportunities and Future Outlook

