PUBLISHER: Mordor Intelligence | PRODUCT CODE: 2113903

PUBLISHER: Mordor Intelligence | PRODUCT CODE: 2113903
Lab Automation For In-Vitro Diagnostics - Market Share Analysis, Industry Trends & Statistics, Growth Forecasts (2026 - 2031)
According to Mordor Intelligence, the lab automation for in-Vitro diagnostics market size was valued at USD 6.11 billion in 2025 and estimated to grow from USD 6.49 billion in 2026 to reach USD 8.77 billion by 2031, at a CAGR of 6.22% during the forecast period (2026-2031).
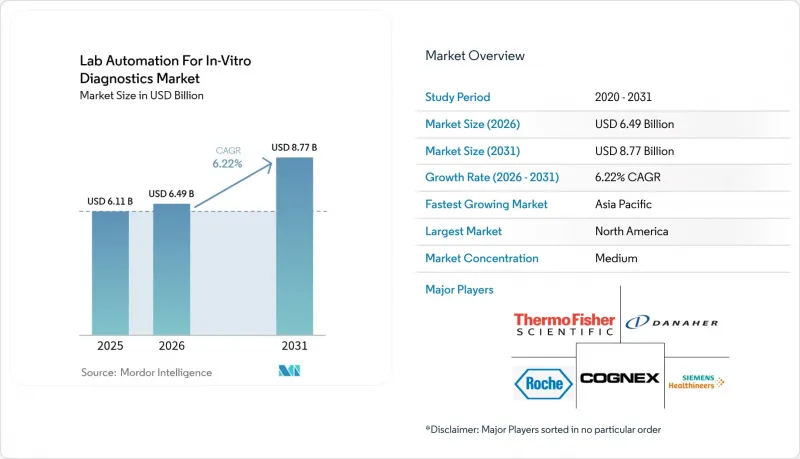
This report is Segmented by Equipment (Automated Plate Handlers, Automated Liquid Handlers, and More), Process Step (Pre-Analytical, Analytical, Post-Analytical, and More), Technology (Clinical-Chemistry, Immunoassay, and More), End User (Hospitals and Reference Labs, Clinical Diagnostics Labs, and More), and Geography. The Market Forecasts are Provided in Terms of Value (USD).
Global Lab Automation For In-Vitro Diagnostics Market Trends and Insights
Demand for High-Throughput Sample Processing
Centralized laboratories now process thousands of daily specimens, and manual workflows cannot meet the 15-20% annual volume growth recorded since 2024. Integrated workcells address this pressure by unifying liquid handling, incubation, and detection in a single production line. Health-system procurement teams increasingly value sample-per-hour metrics above capital cost, shifting tender evaluations toward fully automated configurations. High throughput also supports consolidated quality management because fewer touchpoints lower cumulative error risk. Vendors respond with modular designs that scale from 500 to 5,000 samples per shift, allowing hospitals to phase investments as test menus expand.
Rising Test Volumes from Chronic-Disease Burden
Population aging and universal screening initiatives generate sustained demand for assays that track diabetes, cardiovascular markers, and oncology biomarkers. Each oncology patient may require multiple molecular panels, effectively multiplying the requisition count per clinical encounter. Developing economies add volume rapidly because public health programs extend diagnostics to rural clinics yet transmit specimens to urban hubs, further taxing central laboratories. Automation delivers consistent pipetting precision necessary for PCR and NGS assays, improving reproducibility across expanding test menus. Government payers favor automated platforms when cost-per-result decreases as batch sizes grow.
High Capital Investment and ROI Uncertainty
Comprehensive automation suites cost USD 500,000-5 million, a hurdle for mid-size private laboratories. CFOs struggle to model savings from error reduction or faster turnaround, lengthening approval cycles. Maintenance contracts and software licenses add recurring fees that elevate total cost of ownership beyond sticker price. Tier-two hospitals sometimes postpone investment until patient volumes reach thresholds that assure a three-to-five-year payback.
Other drivers and restraints analyzed in the detailed report include:
- Shortage of Skilled Technicians Accelerating Automation
- AI-Driven Closed-Loop QC Algorithms
- Interoperability Issues with Legacy LIMS
For complete list of drivers and restraints, kindly check the Table Of Contents.
Segment Analysis
Automated liquid handlers accounted for 37.25% of Lab Automation For In-Vitro Diagnostics market share in 2025, underscoring their role as the backbone of molecular and immunoassay workflows. Robotic grippers and machine-vision modules enable these platforms to integrate centrifugation, heating, and real-time error detection, raising yield per batch. Growing test complexity encourages laboratories to layer ultraviolet decontamination and HEPA filtration into handler enclosures, protecting sensitive nucleic-acid assays. Integrated workcells bundle storage, pipetting, and detection in one chassis, helping facilities conserve floor space while achieving end-to-end automation.
The micro-fluidic segment records the quickest momentum at a 6.66% CAGR. Miniaturized cartridges carry out multiplex PCR, immunoassay, and ELISA reactions with microliter volumes, curbing reagent expense and biohazard waste. Hospitals adopt tabletop micro-fluidic analyzers in emergency departments to provide molecular respiratory panels within an hour. Research centers value the platform for single-cell analytics and organ-on-chip projects that traditional robots cannot handle at scale.
Pre-analytical sample preparation still represents 42.20% of 2025 revenue because barcoding, aliquoting, and decapping remain foundational tasks. Advances in adaptive grippers and artificial-vision inspection lower hemolysis and clot detection errors, improving downstream result integrity. Yet laboratories increasingly measure return on investment by complete turnaround time, causing attention to migrate toward data orchestration.
Data management and connectivity posts a 6.86% CAGR, benefiting from middleware that unifies analytical islands into a real-time dashboard. Cloud-hosted platforms synchronize instrument performance, reagent inventory, and quality metrics across multi-hospital networks, supporting enterprise-wide decision making. Vendors integrate application programming interfaces that feed anonymized data into research pipelines, converting routine diagnostics into discovery assets while meeting privacy regulations.
Complete Report Scope:
- By Equipment
- Automated Plate Handlers
- Automated Liquid Handlers
- Robotic Arms
- Automated Storage and Retrieval Systems
- Analyzers
- Integrated Workcells
- Micro-fluidic Platforms
- By Process Step
- Pre-analytical (Sample Prep)
- Analytical
- Post-analytical
- Data Management and Connectivity
- By Technology
- Clinical-chemistry Automation
- Immunoassay Automation
- Molecular and PCR Automation
- NGS Library-prep Automation
- ELISA Automation
- By End User
- Hospitals and Reference Laboratories
- Clinical Diagnostics Laboratories
- Academic and Research Institutions
- Biopharma and Biotechnology Companies
- Other End Users
- By Geography
- North America
- United States
- Canada
- Mexico
- South America
- Brazil
- Argentina
- Chile
- Rest of South America
- Europe
- Germany
- United Kingdom
- France
- Italy
- Netherlands
- Rest of Europe
- Asia-Pacific
- China
- India
- Japan
- South Korea
- Rest of Asia-Pacific
- Middle East and Africa
- Middle East
- Saudi Arabia
- United Arab Emirates
- Turkey
- Rest of Middle East
- Africa
- South Africa
- Nigeria
- Rest of Africa
- Middle East
- North America
Geography Analysis
North America's 38.20% revenue contribution in 2025 mirrors the region's stringent quality standards and early reimbursement for molecular diagnostics. U.S. health networks expand centralized testing hubs that courier specimens overnight, stimulating orders for high-throughput integrated lines. Canada's public plans fund provincial genomics centers that adopt micro-fluidic automation to manage limited technician rosters.
Europe demonstrates balanced adoption as IVDR rules enforce electronic traceability and proficiency testing. Germany anchors vendor revenue with its dense hospital laboratory base, while the Netherlands champions early field trials of cloud-connected workflow managers. United Kingdom procurement favors service contracts that bundle hardware, reagents, and informatics under operating leases, easing budget approvals during NHS modernization.
Asia-Pacific leads expansion at 6.66% CAGR through 2031. China subsidizes regional diagnostic chains that outfit multi-story labs with robotic sorters and track-and-trace conveyors. India's private hospitals set up molecular suites using mid-capacity liquid handlers to compete on oncology turnaround time. Japan's super-aging society keeps per-capita test volumes high, and domestic vendors partner with universities to pilot AI-enabled quality modules. ASEAN economies focus on micro-fluidic point-of-care devices for infectious diseases where central lab access is limited.
- F. Hoffmann-La Roche AG
- Danaher Corporation
- Abbott Laboratories
- Siemens Healthineers AG
- Thermo Fisher Scientific Inc.
- Becton, Dickinson and Company
- PerkinElmer, Inc.
- Agilent Technologies, Inc.
- Tecan Group Ltd.
- Bio-Rad Laboratories, Inc.
- Hamilton Company
- Qiagen N.V.
- Illumina, Inc.
- Azenta, Inc. (Brooks Automation)
- Cognex Corporation
- Beckman Coulter, Inc.
- Analytik Jena GmbH
- Eppendorf SE
- LGC Limited
- Sias AG
Additional Benefits:
- The market estimate (ME) sheet in Excel format
- 3 months of analyst support
TABLE OF CONTENTS
1 INTRODUCTION
- 1.1 Study Assumptions and Market Definition
- 1.2 Scope of the Study
2 RESEARCH METHODOLOGY
3 EXECUTIVE SUMMARY
4 MARKET LANDSCAPE
- 4.1 Market Overview
- 4.2 Market Drivers
- 4.2.1 Demand for high-throughput sample processing
- 4.2.2 Rising test volumes from chronic-disease burden
- 4.2.3 Shortage of skilled technicians accelerating automation
- 4.2.4 AI-driven closed-loop QC algorithms
- 4.2.5 Decentralization of genomics to hospital labs
- 4.2.6 EU IVDR traceability mandates
- 4.3 Market Restraints
- 4.3.1 High capital investment and ROI uncertainty
- 4.3.2 Interoperability issues with legacy LIMS
- 4.3.3 Cyber-security risks for networked analyzers
- 4.3.4 Robotics-component supply-chain volatility
- 4.4 Industry Value Chain Analysis
- 4.5 Regulatory Landscape
- 4.6 Technological Outlook
- 4.7 Porter's Five Forces Analysis
- 4.7.1 Threat of New Entrants
- 4.7.2 Bargaining Power of Buyers
- 4.7.3 Bargaining Power of Suppliers
- 4.7.4 Threat of Substitutes
- 4.7.5 Competitive Rivalry
- 4.8 Macroeconomic Impact Analysis
5 MARKET SIZE AND GROWTH FORECASTS (VALUE)
- 5.1 By Equipment
- 5.1.1 Automated Plate Handlers
- 5.1.2 Automated Liquid Handlers
- 5.1.3 Robotic Arms
- 5.1.4 Automated Storage and Retrieval Systems
- 5.1.5 Analyzers
- 5.1.6 Integrated Workcells
- 5.1.7 Micro-fluidic Platforms
- 5.2 By Process Step
- 5.2.1 Pre-analytical (Sample Prep)
- 5.2.2 Analytical
- 5.2.3 Post-analytical
- 5.2.4 Data Management and Connectivity
- 5.3 By Technology
- 5.3.1 Clinical-chemistry Automation
- 5.3.2 Immunoassay Automation
- 5.3.3 Molecular and PCR Automation
- 5.3.4 NGS Library-prep Automation
- 5.3.5 ELISA Automation
- 5.4 By End User
- 5.4.1 Hospitals and Reference Laboratories
- 5.4.2 Clinical Diagnostics Laboratories
- 5.4.3 Academic and Research Institutions
- 5.4.4 Biopharma and Biotechnology Companies
- 5.4.5 Other End Users
- 5.5 By Geography
- 5.5.1 North America
- 5.5.1.1 United States
- 5.5.1.2 Canada
- 5.5.1.3 Mexico
- 5.5.2 South America
- 5.5.2.1 Brazil
- 5.5.2.2 Argentina
- 5.5.2.3 Chile
- 5.5.2.4 Rest of South America
- 5.5.3 Europe
- 5.5.3.1 Germany
- 5.5.3.2 United Kingdom
- 5.5.3.3 France
- 5.5.3.4 Italy
- 5.5.3.5 Netherlands
- 5.5.3.6 Rest of Europe
- 5.5.4 Asia-Pacific
- 5.5.4.1 China
- 5.5.4.2 India
- 5.5.4.3 Japan
- 5.5.4.4 South Korea
- 5.5.4.5 Rest of Asia-Pacific
- 5.5.5 Middle East and Africa
- 5.5.5.1 Middle East
- 5.5.5.1.1 Saudi Arabia
- 5.5.5.1.2 United Arab Emirates
- 5.5.5.1.3 Turkey
- 5.5.5.1.4 Rest of Middle East
- 5.5.5.2 Africa
- 5.5.5.2.1 South Africa
- 5.5.5.2.2 Nigeria
- 5.5.5.2.3 Rest of Africa
- 5.5.5.1 Middle East
- 5.5.1 North America
6 COMPETITIVE LANDSCAPE
- 6.1 Market Concentration
- 6.2 Strategic Moves
- 6.3 Market Share Analysis
- 6.4 Company Profiles (includes Global level Overview, Market level overview, Core Segments, Financials as available, Strategic Information, Market Rank/Share for key companies, Products and Services, and Recent Developments)
- 6.4.1 F. Hoffmann-La Roche AG
- 6.4.2 Danaher Corporation
- 6.4.3 Abbott Laboratories
- 6.4.4 Siemens Healthineers AG
- 6.4.5 Thermo Fisher Scientific Inc.
- 6.4.6 Becton, Dickinson and Company
- 6.4.7 PerkinElmer, Inc.
- 6.4.8 Agilent Technologies, Inc.
- 6.4.9 Tecan Group Ltd.
- 6.4.10 Bio-Rad Laboratories, Inc.
- 6.4.11 Hamilton Company
- 6.4.12 Qiagen N.V.
- 6.4.13 Illumina, Inc.
- 6.4.14 Azenta, Inc. (Brooks Automation)
- 6.4.15 Cognex Corporation
- 6.4.16 Beckman Coulter, Inc.
- 6.4.17 Analytik Jena GmbH
- 6.4.18 Eppendorf SE
- 6.4.19 LGC Limited
- 6.4.20 Sias AG
7 MARKET OPPORTUNITIES AND FUTURE OUTLOOK
- 7.1 White-space and Unmet-need Assessment

