PUBLISHER: Mordor Intelligence | PRODUCT CODE: 2113975

PUBLISHER: Mordor Intelligence | PRODUCT CODE: 2113975
Network Automation - Market Share Analysis, Industry Trends & Statistics, Growth Forecasts (2026 - 2031)
According to Mordor Intelligence, the global network automation market size stood at USD 36.86 billion in 2026 and is projected to reach USD 86.16 billion by 2031, reflecting an 18.51% CAGR over 2026-2031.
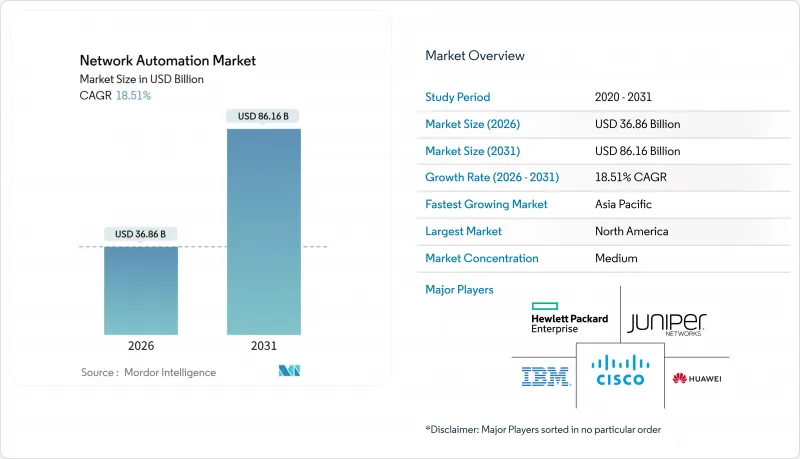
This report is Segmented by Network Infrastructure (Physical, Virtual, and Hybrid), Component (Solutions, and Services), Deployment Mode (Cloud, and On-Premise), Organization Size (Large Enterprises, and Small and Medium Enterprises), End-User Industry (IT and Telecom, Banking and Financial Services, Manufacturing, and More), and Geography. The Market Forecasts are Provided in Terms of Value (USD).
Global Network Automation Market Trends and Insights
Surge in Data-Center Network Upgrades
Hyperscale and colocation providers are rebuilding spine-leaf fabrics around 400 GbE and 800 GbE switching to support GPU clusters that train generative AI models. Manual configuration of tens of thousands of ports risks cascading outages, so organizations are turning to automated intent engines that generate validated configurations and push them at scale. Co-packaged optics and in-network compute highlighted in 2025 roadmaps demand programmable pipelines that legacy CLI workflows cannot orchestrate effectively . Liquid-cooling retrofits further complicate cabling, prompting vendors to bundle physical-layer discovery with infrastructure-as-code templates for real-time topology accuracy.
IoT and Connected-Device Proliferation
The installed base of connected endpoints topped 75 billion in 2025, stretching network capacity and exposing security gaps. Manufacturers cite network complexity as the top barrier to IT-OT convergence because aging SCADA gear lacks encryption and authentication primitives. Automation platforms that integrate device-lifecycle management now onboard sensors, assign segmentation tags, and apply firewall policies without manual tickets, trimming rollout cycles from weeks to hours .
Shortage of Automation-Skilled Engineers
A 4.8-million-person cybersecurity talent gap includes acute shortages in Python, Ansible, and YANG expertise, forcing enterprises to pay premium consulting fees and delaying full-scale deployments. Certification programs and internal academies are ramping up, but productivity gains often trail investment by 12-18 months, eroding early ROI.
Other drivers and restraints analyzed in the detailed report include:
- Rapid SD-WAN and Virtualization Roll-Outs
- Cloud and Multi-Cloud Migration Wave
- Legacy Infrastructure Integration Issues
For complete list of drivers and restraints, kindly check the Table Of Contents.
Segment Analysis
Hybrid architectures captured 45.60% of the network automation market share in 2025, underscoring enterprise reliance on physical underlays for deterministic latency while software overlays unlock agility for emerging workloads. The virtual tier is on an 18.80% CAGR through 2031, propelled by container network interfaces that automate micro-segmentation. Hybrid topologies allow gradual migration, enabling organizations to pilot SD-WAN at the edge before extending automation inward. Cisco reported that 63% of its SD-WAN customers ran mixed MPLS and broadband paths, highlighting the staying power of multi-transport strategies.
Operators use hybrid models to hedge against vendor lock-in because virtual functions can be swapped without replacing switching hardware. The TM Forum's 2025 Open Digital Architecture codified intent APIs, helping carriers integrate best-of-breed components . Physical vendors are embedding gRPC exporters and YANG interfaces, turning legacy chassis into programmable nodes that slot into infrastructure-as-code pipelines. Consequently, the hybrid paradigm is likely to remain the backbone of the network automation market well into the forecast horizon.
Solutions held 62.31% of revenue in 2025, but services are forecast to rise at a 19.40% CAGR as enterprises outsource design, integration, and managed operations. Demand spans architecture consulting, proofs-of-concept, and custom connector development for legacy OSS/BSS systems. Training revenues surged 22% year over year at Red Hat, underscoring the urgent need to reskill operations teams.
AI recommendation engines now ship inside automation suites, yet they require tuning to each customer's topology, creating high-margin opportunities for integrators. Managed-service providers guarantee uptime and compliance, shifting operational risk off customers' balance sheets. This dynamic indicates that professional and managed services will continue commanding a premium portion of the network automation market size, even as software matures.
Complete Report Scope:
- By Network Infrastructure
- Physical
- Virtual
- Hybrid
- By Component
- Solutions
- Services
- By Deployment Mode
- Cloud
- On-Premise
- By Organization Size
- Large Enterprises
- Small and Medium Enterprises
- By End-User Industry
- IT and Telecom
- Banking and Financial Services
- Manufacturing
- Energy and Utilities
- Education
- Healthcare
- Government and Defense
- Other Industries
- By Geography
- North America
- United States
- Canada
- Mexico
- Europe
- Germany
- United Kingdom
- France
- Italy
- Spain
- Russia
- Rest of Europe
- Asia-Pacific
- China
- Japan
- India
- South Korea
- Australia
- Rest of Asia-Pacific
- Middle East
- Saudi Arabia
- United Arab Emirates
- Turkey
- Rest of Middle East
- Africa
- South Africa
- Nigeria
- Rest of Africa
- South America
- Brazil
- Argentina
- Rest of South America
- North America
Geography Analysis
North America held 38.43% of the network automation market in 2025. Federal zero-trust directives, dense hyperscale data-center footprints, and active financial hubs drive continued spending. Regulators encourage rural fiber builds, increasing demand for automated provisioning that minimizes truck rolls.
Asia-Pacific is projected to register a 21.43% CAGR from 2026-2031. Nationwide 5G rollouts in China, India, Japan, and South Korea require zero-touch slicing and radio parameter optimization. China Mobile's 5G-Advanced trials showcased AI-driven energy savings, while Indian carriers rely on automation to integrate legacy 4G with standalone 5G cores. Open RAN pilots in Japan increase multi-vendor complexity, heightening the need for orchestration.
Europe's growth is steadier but supported by the NIS2 Directive's 24-hour incident-reporting mandate. Germany's Industry 4.0 programs demand microsecond-level synchronization, prompting investments in time-sensitive networking. The Middle East invests under Vision 2030 and national AI strategies, while Latin America and Africa expand 4G and 5G to underserved areas, using automation to compensate for limited onsite talent. Brazil's spectrum auctions and South Africa's fiber rollouts attest to rising regional interest.
- Cisco Systems Inc.
- Juniper Networks Inc.
- IBM Corporation
- Hewlett Packard Enterprise Company
- Arista Networks Inc.
- VMware Inc.
- SolarWinds Corporation
- BMC Software Inc.
- Extreme Networks Inc.
- NetBrain Technologies Inc.
- Forward Networks Inc.
- Nuage Networks (Nokia Corp.)
- Huawei Technologies Co. Ltd.
- Red Hat Inc.
- Fortra LLC
- OpenText Corporation
- Fujitsu Limited
- Broadcom Inc.
- Broadcom Inc.
- F5 Inc.
- Anuta Networks Inc.
- Micro Focus International plc
- BlueCat Networks
- Apstra Inc.
Additional Benefits:
- The market estimate (ME) sheet in Excel format
- 3 months of analyst support
TABLE OF CONTENTS
1 INTRODUCTION
- 1.1 Study Assumptions and Market Definition
- 1.2 Scope of the Study
2 RESEARCH METHODOLOGY
3 EXECUTIVE SUMMARY
4 MARKET LANDSCAPE
- 4.1 Market Overview
- 4.2 Market Drivers
- 4.2.1 Surge in Data-Center Network Upgrades
- 4.2.2 IoT and Connected-Device Proliferation
- 4.2.3 Rapid SD-WAN and Virtualization Roll-Outs
- 4.2.4 Cloud and Multi-Cloud Migration Wave
- 4.2.5 AI-Driven Self-Healing Intent-Based Networks
- 4.2.6 Zero-Touch 5G Network-Slicing Monetization
- 4.3 Market Restraints
- 4.3.1 Shortage of Automation-Skilled Engineers
- 4.3.2 Legacy Infrastructure Integration Issues
- 4.3.3 Proprietary Platform Vendor-Lock-In Risk
- 4.3.4 Cross-Border Change-Control Compliance
- 4.4 Industry Value Chain Analysis
- 4.5 Regulatory Landscape
- 4.6 Technological Outlook
- 4.7 Impact of Macroeconomic Factors
- 4.8 Porter's Five Forces Analysis
- 4.8.1 Threat of New Entrants
- 4.8.2 Bargaining Power of Suppliers
- 4.8.3 Bargaining Power of Buyers
- 4.8.4 Threat of Substitutes
- 4.8.5 Competitive Rivalry
5 MARKET SIZE AND GROWTH FORECASTS (VALUE)
- 5.1 By Network Infrastructure
- 5.1.1 Physical
- 5.1.2 Virtual
- 5.1.3 Hybrid
- 5.2 By Component
- 5.2.1 Solutions
- 5.2.2 Services
- 5.3 By Deployment Mode
- 5.3.1 Cloud
- 5.3.2 On-Premise
- 5.4 By Organization Size
- 5.4.1 Large Enterprises
- 5.4.2 Small and Medium Enterprises
- 5.5 By End-User Industry
- 5.5.1 IT and Telecom
- 5.5.2 Banking and Financial Services
- 5.5.3 Manufacturing
- 5.5.4 Energy and Utilities
- 5.5.5 Education
- 5.5.6 Healthcare
- 5.5.7 Government and Defense
- 5.5.8 Other Industries
- 5.6 By Geography
- 5.6.1 North America
- 5.6.1.1 United States
- 5.6.1.2 Canada
- 5.6.1.3 Mexico
- 5.6.2 Europe
- 5.6.2.1 Germany
- 5.6.2.2 United Kingdom
- 5.6.2.3 France
- 5.6.2.4 Italy
- 5.6.2.5 Spain
- 5.6.2.6 Russia
- 5.6.2.7 Rest of Europe
- 5.6.3 Asia-Pacific
- 5.6.3.1 China
- 5.6.3.2 Japan
- 5.6.3.3 India
- 5.6.3.4 South Korea
- 5.6.3.5 Australia
- 5.6.3.6 Rest of Asia-Pacific
- 5.6.4 Middle East
- 5.6.4.1 Saudi Arabia
- 5.6.4.2 United Arab Emirates
- 5.6.4.3 Turkey
- 5.6.4.4 Rest of Middle East
- 5.6.5 Africa
- 5.6.5.1 South Africa
- 5.6.5.2 Nigeria
- 5.6.5.3 Rest of Africa
- 5.6.6 South America
- 5.6.6.1 Brazil
- 5.6.6.2 Argentina
- 5.6.6.3 Rest of South America
- 5.6.1 North America
6 COMPETITIVE LANDSCAPE
- 6.1 Market Concentration
- 6.2 Strategic Moves
- 6.3 Market Share Analysis
- 6.4 Company Profiles (includes Global level Overview, Market level overview, Core Segments, Financials as available, Strategic Information, Market Rank/Share for key companies, Products and Services, and Recent Developments)
- 6.4.1 Cisco Systems Inc.
- 6.4.2 Juniper Networks Inc.
- 6.4.3 IBM Corporation
- 6.4.4 Hewlett Packard Enterprise Company
- 6.4.5 Arista Networks Inc.
- 6.4.6 VMware Inc.
- 6.4.7 SolarWinds Corporation
- 6.4.8 BMC Software Inc.
- 6.4.9 Extreme Networks Inc.
- 6.4.10 NetBrain Technologies Inc.
- 6.4.11 Forward Networks Inc.
- 6.4.12 Nuage Networks (Nokia Corp.)
- 6.4.13 Huawei Technologies Co. Ltd.
- 6.4.14 Red Hat Inc.
- 6.4.15 Fortra LLC
- 6.4.16 OpenText Corporation
- 6.4.17 Fujitsu Limited
- 6.4.18 Broadcom Inc.
- 6.4.19 Broadcom Inc.
- 6.4.20 F5 Inc.
- 6.4.21 Anuta Networks Inc.
- 6.4.22 Micro Focus International plc
- 6.4.23 BlueCat Networks
- 6.4.24 Apstra Inc.
7 MARKET OPPORTUNITIES AND FUTURE OUTLOOK
- 7.1 White-Space and Unmet-Need Assessment

