PUBLISHER: Mordor Intelligence | PRODUCT CODE: 2114183

PUBLISHER: Mordor Intelligence | PRODUCT CODE: 2114183
Process Oils - Market Share Analysis, Industry Trends & Statistics, Growth Forecasts (2026 - 2031)
According to Mordor Intelligence, the process oils market size is estimated at 5.33 million tons in 2026, and is expected to reach 6.06 million tons by 2031, at a CAGR of 2.61% during the forecast period (2026-2031).
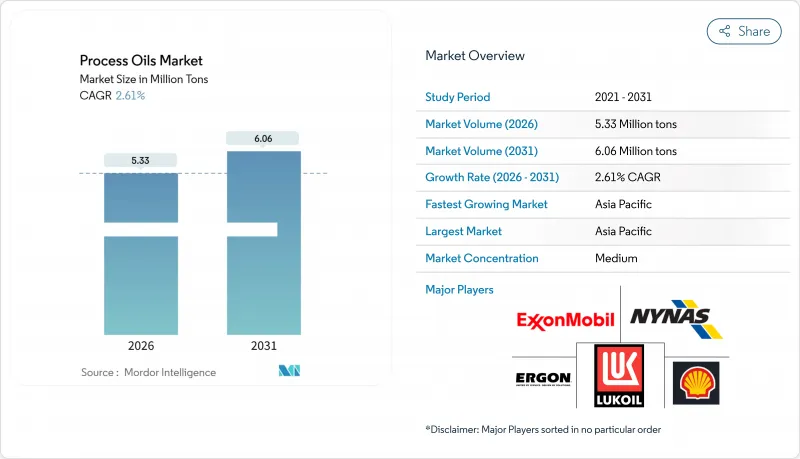
This report is Segmented by Type (Aromatic, Paraffinic, and Naphthenic), Application (Rubber, Polymers, Personal Care, Textile, and Other Applications), and Geography (Asia-Pacific, North America, Europe, South America, and Middle-East and Africa). The Market Forecasts are Provided in Terms of Volume (Tons).
Global Process Oils Market Trends and Insights
Rising Polymer And Synthetic Rubber Capacity Additions
Evonik's new polybutadiene unit in Shanghai, which came online recently, has boosted the captive demand for low-viscosity process oils. Meanwhile, Dow's utilization rate indicates a tightening market, prompting debottlenecking efforts linked to multi-year supply contracts with integrated refiners. Naphthenic grades gain share as solution-polymerized rubber formulas need superior solvency, and Asian producers leverage co-located feedstock to secure margins. These dynamics enlarge the addressable base for the process oil market, reinforcing mid-term growth. Merchant refiners without captive base oil streams face thinner spreads, pushing them toward specialty niches or import strategies.
Elevated Demand From High-Performance Tire Formulations
China's tire production has seen significant growth, with premium radial categories incorporating process oils per compound, signaling strong demand. While premium segments embrace "green" tires, which utilize silica to reduce rolling resistance, these innovations hinge on treated distillate aromatic extract (TDAE) or bio-based substitutes. These substitutes must adhere to a PAH ceiling, a benchmark now adopted by global OEMs. Meanwhile, in South Asia and Africa, bias-ply and off-road tires continue to favor more affordable aromatic extracts. This choice not only highlights a geographic arbitrage but also bolsters legacy capacities in those regions. As tire formulations evolve, they introduce a broader spectrum of grade requirements, ensuring the process oil market remains closely tied to the automotive industry's rhythms.
Stringent PAH Limits On Aromatic Extracts In EU And North America
In response to REACH Annex XVII's ban on process oils containing benzo[a]pyrene and total PAHs above specified thresholds, tire companies have been forced to move away from conventional extracts. Echoing these measures, North American regulators, via California statutes, set similar thresholds. This regulatory alignment, coupled with Shell's 2025 closure of its Pernis aromatics unit and ExxonMobil's 2023 exit from Beaumont, has led to a diminished supply of compliant TDAE. Consequently, spot TDAE prices increased, putting pressure on cost-sensitive compounders and stifling short-term growth in the process oil market.
Other drivers and restraints analyzed in the detailed report include:
- Growth Of Naphthenic Oils In Metal-Working Fluids For EV Manufacturing
- Surging Personal-Care Formulations Using White Process Oils
- Group I Base-Oil Refinery Shutdowns Tightening Feedstock Supply
For complete list of drivers and restraints, kindly check the Table Of Contents.
Segment Analysis
Naphthenic grades held 44.28% of the process oil market share in 2025 and are growing at a 6.03% CAGR, a rare blend of scale and velocity. Their cycloparaffinic structure delivers low-temperature fluidity and high solvency, making them indispensable in EV metal-working fluids and ultra-low-PAH tire treads. Paraffinic oils fill mid-range needs in rubber and polymers, while aromatic oils retain a foothold in bias-ply tires and asphalt in Asia-Pacific where enforcement is looser.
Nynas, Ergon, and Calumet are investing in application labs to co-develop naphthenic solutions with tire makers, locking in long contracts that buffer them from crude swings. Abundant Group II and III paraffinic feedstock keeps paraffinic prices competitive, yet commoditization erodes margins. Should China and India adopt EU-equivalent PAH norms later this decade, significant aromatic demand could vanish, stranding assets in South Korea and Thailand. These cross-currents keep the process oil market fluid, rewarding flexible producers.
Complete Report Scope:
- By Type
- Aromatic
- Paraffinic
- Naphthenic
- By Application
- Rubber
- Polymers
- Personal Care
- Textile
- Other Applications
- By Geography
- Asia-Pacific
- China
- India
- Japan
- South Korea
- ASEAN Countries
- Rest of Asia-Pacific
- North America
- United States
- Canada
- Mexico
- Europe
- Germany
- United Kingdom
- France
- Italy
- Spain
- Russia
- Rest of Europe
- South America
- Brazil
- Argentina
- Rest of South America
- Middle-East and Africa
- Saudi Arabia
- South Africa
- Rest of Middle-East and Africa
- Asia-Pacific
Geography Analysis
Asia-Pacific held 66.06% of the process oil market size in 2025 and is poised for a 2.94% CAGR through 2031. Integrated complexes at Maoming, Dalian, and Jinling co-produce base oils and process oils, giving Sinopec and PetroChina a delivered-cost edge. China's tire production consumes a significant amount of oil. Indian demand is rising as commercial fleets upsize, while South Korea and Japan export premium white oils for electronics and pharma niches. The region's feedstock security and scale suggest its share could even inch higher, cementing leadership in the global process oil market.
After Group I closures at Beaumont, El Segundo, and San Francisco reduced annual capacity, North America grapples with structural shortages. While Calumet, HF Sinclair, and Ergon operate near full capacity, spot shortfalls have driven TDAE prices up. Although imports from South Korea help fill the void, they come with a hefty freight cost, squeezing buyer margins. With Canada boasting a smaller base-oil slate, its reliance on imports is set to continue, curbing volume growth in the process oil market.
Europe mirrors this pattern: Shell's Pernis shutdown and Total's Gonfreville conversion tightened supply even as tire demand from Michelin and Continental stayed firm. Compliance with REACH PAH limits has accelerated the move to hydro-treated paraffinic and naphthenic grades, lifting average unit values. South America and the Middle-East and Africa remain slender but rising outlets, thanks to Chinese tire manufacturers establishing plants in Brazil and South Africa. Freight economics make localized supply attractive, inviting investments by Petrobras and Sasol to capture regional slices of the process oil market.
- Calumet, Inc.
- Chevron Corporation
- China Petroleum & Chemical Corporation.
- ENEOS Corporation
- Ergon Inc.
- Exxon Mobil Corporation
- H&R GROUP
- HF Sinclair Corporation
- Idemitsu Kosan Co. Ltd.
- LUKOIL
- Neste
- Nynas AB
- ORGKHIM Biochemical Holding
- Panama Petrochem Ltd.
- PetroChina
- PETRONAS Lubricants International
- Phillips 66 Company
- SEOJIN CHEMICAL CO.,LTD.
- Shell plc
- TotalEnergies SE
Additional Benefits:
- The market estimate (ME) sheet in Excel format
- 3 months of analyst support
TABLE OF CONTENTS
1 Introduction
- 1.1 Study Assumptions and Market Definition
- 1.2 Scope of the Study
2 Research Methodology
3 Executive Summary
4 Market Landscape
- 4.1 Market Overview
- 4.2 Market Drivers
- 4.2.1 Rising polymer and synthetic rubber capacity additions
- 4.2.2 Elevated demand from high-performance tire formulations
- 4.2.3 Growth of naphthenic oils in metal-working fluids for EV manufacturing
- 4.2.4 Surging personal-care formulations using white process oils
- 4.2.5 Shift to ultra-low VOC printing inks using hydro-treated process oils
- 4.3 Market Restraints
- 4.3.1 Stringent PAH limits on aromatic extracts in European Union and North America
- 4.3.2 Group I base-oil refinery shutdowns tightening feedstock supply
- 4.3.3 Price volatility linked to crude and base-oil crack spreads
- 4.4 Value Chain Analysis
- 4.5 Porter's Five Forces
- 4.5.1 Bargaining Power of Suppliers
- 4.5.2 Bargaining Power of Buyers
- 4.5.3 Threat of New Entrants
- 4.5.4 Threat of Substitutes
- 4.5.5 Degree of Competition
5 Market Size and Growth Forecasts (Volume)
- 5.1 By Type
- 5.1.1 Aromatic
- 5.1.2 Paraffinic
- 5.1.3 Naphthenic
- 5.2 By Application
- 5.2.1 Rubber
- 5.2.2 Polymers
- 5.2.3 Personal Care
- 5.2.4 Textile
- 5.2.5 Other Applications
- 5.3 By Geography
- 5.3.1 Asia-Pacific
- 5.3.1.1 China
- 5.3.1.2 India
- 5.3.1.3 Japan
- 5.3.1.4 South Korea
- 5.3.1.5 ASEAN Countries
- 5.3.1.6 Rest of Asia-Pacific
- 5.3.2 North America
- 5.3.2.1 United States
- 5.3.2.2 Canada
- 5.3.2.3 Mexico
- 5.3.3 Europe
- 5.3.3.1 Germany
- 5.3.3.2 United Kingdom
- 5.3.3.3 France
- 5.3.3.4 Italy
- 5.3.3.5 Spain
- 5.3.3.6 Russia
- 5.3.3.7 Rest of Europe
- 5.3.4 South America
- 5.3.4.1 Brazil
- 5.3.4.2 Argentina
- 5.3.4.3 Rest of South America
- 5.3.5 Middle-East and Africa
- 5.3.5.1 Saudi Arabia
- 5.3.5.2 South Africa
- 5.3.5.3 Rest of Middle-East and Africa
- 5.3.1 Asia-Pacific
6 Competitive Landscape
- 6.1 Market Concentration
- 6.2 Strategic Moves
- 6.3 Market Share/Ranking Analysis
- 6.4 Company Profiles {(includes Global level Overview, Market level overview, Core Segments, Financials as available, Strategic Information, Market Rank/Share for key companies, Products and Services, and Recent Developments)}
- 6.4.1 Calumet, Inc.
- 6.4.2 Chevron Corporation
- 6.4.3 China Petroleum & Chemical Corporation.
- 6.4.4 ENEOS Corporation
- 6.4.5 Ergon Inc.
- 6.4.6 Exxon Mobil Corporation
- 6.4.7 H&R GROUP
- 6.4.8 HF Sinclair Corporation
- 6.4.9 Idemitsu Kosan Co. Ltd.
- 6.4.10 LUKOIL
- 6.4.11 Neste
- 6.4.12 Nynas AB
- 6.4.13 ORGKHIM Biochemical Holding
- 6.4.14 Panama Petrochem Ltd.
- 6.4.15 PetroChina
- 6.4.16 PETRONAS Lubricants International
- 6.4.17 Phillips 66 Company
- 6.4.18 SEOJIN CHEMICAL CO.,LTD.
- 6.4.19 Shell plc
- 6.4.20 TotalEnergies SE
7 Market Opportunities and Future Outlook
- 7.1 White-space and Unmet-need Assessment

