PUBLISHER: Mordor Intelligence | PRODUCT CODE: 2114556

PUBLISHER: Mordor Intelligence | PRODUCT CODE: 2114556
Emission Monitoring Systems - Market Share Analysis, Industry Trends & Statistics, Growth Forecasts (2026 - 2031)
According to Mordor Intelligence, the emission monitoring systems market size is projected to be USD 3.48 billion in 2025, USD 3.71 billion in 2026, and reach USD 5.12 billion by 2031, growing at a CAGR of 6.68% from 2026 to 2031.
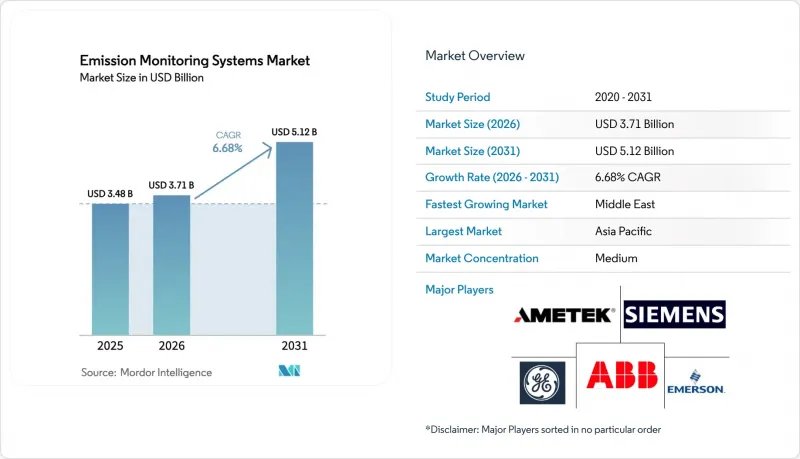
This report is Segmented by System Type (CEMS, and PEMS), Component (Hardware, Software, and Services), Monitoring Technology (Extractive, Dilution, and In-Situ), End-User Industry (Power Generation, Oil and Gas, and More), and Geography (North America, South America, Europe, Asia Pacific, Middle East, Africa). The Market Forecasts are Provided in Terms of Value (USD).
Global Emission Monitoring Systems Market Trends and Insights
Transition From CAPEX-Heavy CEMS to Hybrid CEMS-PEMS Architectures in Europe
European operators overlay predictive emission monitoring models on existing continuous analyzers to curb capital spending, cut installation from 12 weeks to 4 weeks, and accelerate compliance reporting. Germany's Federal Immission Control Act endorses predictive methods for low-emission units once quarterly crosschecks confirm model accuracy within +-10%. The Netherlands and United Kingdom grant similar flexibility for refinery flares, trimming hardware budgets 40%-50% for ancillary stacks. Utilities with mature data-science teams exploit process variables such as fuel flow, excess oxygen, and flame temperature to calculate nitrogen oxides and sulfur dioxide in real time, reducing unscheduled downtime for analyzer maintenance. Smaller plants struggle to maintain the statistical models, prompting a services opportunity for vendors that bundle software, calibration gases, and regulatory reporting. The hybrid path also supports faster technology refresh cycles because model coefficients update in software rather than through hardware swaps.
Mandatory EU-ETS Phase IV Carbon Pricing Driving Stack-Level Monitoring
EU-ETS Phase IV tightened the cap reduction factor to 4.3% in 2024, pushing spot prices to EUR 80-EUR 100 per metric ton (USD 90-USD 113) during 2025. A 500 MW coal plant emitting 3 million tCO2 per year faces EUR 240 million (USD 272 million) in annual allowance costs, so a +-2% measurement margin mandated by EN 14181 directly influences cash flow. Operators retrofit heated extractive lines, redundant analyzers, and automated drift diagnostics to meet the precision threshold. Poland and Spain alone represented 38% of new orders in 2025 as facilities rushed to secure monitoring-plan approvals before the 2026 deadline. Vendors with full EN 15267 certification libraries command premium pricing, although regional utilities increasingly demand remote calibration to overcome technician shortages.
Scarcity of TUV and MCERTS-Certified Technicians Delaying European Commissioning
Field certification under EN 15267 requires accredited engineers to perform multi-point calibration, linearity checks, and relative accuracy testing. TUV SUD logged a 40% rise in requests during 2025 yet expanded its engineer roster only 12%, lifting average wait times from 8 weeks to 18 weeks in Germany, Poland, and Spain. Smaller operators defer upgrades or accept provisional permits that rely on manual stack tests, eroding real-time visibility for regulators. The shortage sparks price inflation for certification services and encourages larger utilities to self-fund technician training programs, but accreditation lead times restrain quick fixes.
Other drivers and restraints analyzed in the detailed report include:
- Inflation Reduction Act Verification Creating United States Retrofit Surge
- In-Situ Laser Sensors Cutting Lifecycle Cost by 30% in Asia Pacific Waste-to-Energy Plants
- High Humidity Bias Raising False-Compliance Risk in Tropical Regions
For complete list of drivers and restraints, kindly check the Table Of Contents.
Segment Analysis
Continuous solutions retained a 68.64% share in 2025, anchored by decades of codified requirements under EU-ETS, the United States Clean Air Act, and China's ultra-low emission rules. Predictive models will register a 7.87% annual advance, capturing interest from operators keen to avoid analyzer duplication on ancillary stacks. The emission monitoring systems market size for predictive models is forecast to exceed USD 1.2 billion by 2031, reflecting their role in digitally mature utilities. Early adopters in Germany and the United States exploit real-time process variables to simulate nitrogen oxides within +-10% of extractive readings, satisfying regulators while shaving hardware budgets by nearly half. Middle Eastern refineries remain cautious because long-term leases signed a decade ago lock them into fixed continuous contracts until 2028-2030, but hybrid pilots on flare systems are underway with regulatory oversight from Saudi Arabia's National Environment Strategy.
In North America, combined-cycle gas turbines use predictive algorithms during cycling operation to avoid downtime when extractive analyzers require maintenance. Asia Pacific utilities adopt a split strategy, retaining continuous analyzers on primary boilers and deploying predictive models on secondary units to align with China's digital-twin policy for coal plants. Cloud vendors that combine neural-network modeling with enterprise carbon accounting gain traction because they simplify quarterly regulatory reporting. As more jurisdictions recognize predictive techniques, the emission monitoring systems market will likely see regulatory language shift from prescriptive hardware mandates to performance-based accuracy thresholds.
Hardware accounted for 44.16% of 2025 spending, reflecting a mature installed base of gas analyzers, flow meters, and data acquisition units. Software will grow 8.27% each year through 2031 as operators integrate real-time stack data with enterprise resource planning and environmental, social, and governance dashboards. A 15-plant European utility consolidated data from 60 stacks into a cloud portal in 2025, trimming calibration labor 25% by automating drift alerts. Cloud platforms also underpin predictive maintenance, notifying technicians before sensor fouling degrades accuracy, thereby protecting compliance margins.
Services (installation, calibration, third-party certification, and multi-year maintenance) capture the balance of revenue and ride the cumulative installed base. Vendors tie software subscriptions to service agreements, offsetting hardware commoditization. Gas analyzers remain the revenue cornerstone, especially nondispersive infrared CO2 cells and chemiluminescence nitrogen oxide detectors, yet open-protocol data acquisition hardware grows fastest as operators demand OPC UA and Ethernet to avoid vendor lock-in. As software penetration rises, the emission monitoring systems industry pivots toward recurring revenue models built on analytics rather than box sales.
Complete Report Scope:
- By System Type
- Continuous Emission Monitoring Systems (CEMS)
- Predictive Emission Monitoring Systems (PEMS)
- By Component
- Hardware
- Gas Analyzers
- Flow and Opacity Monitors
- Data Acquisition Systems (DAS)
- Software
- Stand-Alone
- Cloud-Hosted
- Services
- Installation and Deployment
- Calibration and Certification
- Support and Maintenance
- Hardware
- By Monitoring Technology
- Extractive
- Hot-Wet
- Cold-Dry
- Dilution
- In-Situ
- Tunable Diode Laser Spectroscopy (TDLS)
- Extractive
- By End-User Industry
- Power Generation
- Coal-Fired
- Combined-Cycle Gas Turbines
- Oil and Gas
- Upstream
- Midstream
- Downstream and Refineries
- Metals and Mining
- Chemicals and Petrochemicals
- Pharmaceuticals
- Cement and Aggregates
- Pulp and Paper
- Waste-to-Energy and Incineration
- Maritime (Ship-Board)
- Power Generation
- By Geography
- North America
- United States
- Canada
- Mexico
- South America
- Brazil
- Argentina
- Rest of South America
- Europe
- United Kingdom
- Germany
- France
- Italy
- Spain
- Russia
- Rest of Europe
- Asia Pacific
- China
- India
- Japan
- South Korea
- Australia
- Southeast Asia
- Rest of Asia Pacific
- Middle East
- United Arab Emirates
- Saudi Arabia
- Turkey
- Rest of Middle East
- Africa
- South Africa
- Nigeria
- Egypt
- Rest of Africa
- North America
Geography Analysis
Asia Pacific retained 36.17% of revenue in 2025, anchored by China's coal capacity, India's National Clean Air Programme rollouts, and Southeast Asian waste-to-energy projects. The region's policy mix of ultra-low emission standards and municipal-solid-waste directives sustains hardware replacement and software upgrades, while local fabricators in China and South Korea intensify price pressure on Western suppliers. The emission monitoring systems market size in Asia Pacific is forecast to climb steadily as in-situ laser uptake offsets extractive saturation.
The Middle East emerges as the fastest-growing region at an 8.19% CAGR through 2031. Saudi Arabia's National Environment Strategy mandates continuous monitoring for thermal inputs above 50 MW by 2027, compelling refineries, desalination plants, and gas-fired power stations to install analyzers on stacks that previously relied on annual tests. The United Arab Emirates enacted Federal Decree-Law 24-2022, giving industrial operators three years to adopt best available techniques, including continuous monitoring. Refinery upgrades and petrochemical debottlenecking drive bundled analyzer-plus-service contracts that elevate regional spend.
Europe remains large and compliance-driven, with Germany, Poland, Spain, and Italy accounting for most installations. Tightened EU-ETS rules and Industrial Emissions Directive standards encourage analyzer replacements that deliver +-2% accuracy. North America sees retrofit momentum as United States tax credits reward verified emission cuts, and Canada's Output-Based Pricing System expands to more provinces. South America adds selective demand in Brazil, Argentina, and Mexico as state-level air agencies adopt continuous monitoring, while Africa concentrates activity in South Africa, Nigeria, and Egypt where multinational plants align with export-market environmental norms. Collectively, these dynamics ensure global diversity in the emission monitoring systems market.
- ABB Ltd.
- Siemens AG
- Emerson Electric Co.
- General Electric Company
- AMETEK Inc.
- Thermo Fisher Scientific Inc.
- Honeywell International Inc.
- Teledyne Technologies Inc.
- HORIBA Ltd.
- SICK AG
- Rockwell Automation Inc.
- Fuji Electric Co. Ltd.
- Advanced Emissions Solutions Inc.
- ENVEA Global SAS
- Parker Hannifin Corp.
- Baker Hughes Co.
- Cemtrex Inc.
- Babcock and Wilcox Enterprises Inc.
- Opsis AB
- Altech Environment U.S.A.
Additional Benefits:
- The market estimate (ME) sheet in Excel format
- 3 months of analyst support
TABLE OF CONTENTS
1 INTRODUCTION
- 1.1 Study Assumptions and Market Definition
- 1.2 Scope of the Study
2 RESEARCH METHODOLOGY
3 EXECUTIVE SUMMARY
4 MARKET LANDSCAPE
- 4.1 Market Overview
- 4.2 Market Drivers
- 4.2.1 Transition From CAPEX-Heavy CEMS to Hybrid CEMS-PEMS Architectures in Europe
- 4.2.2 Mandatory EU-ETS Phase-IV Carbon Pricing Driving Stack-Level Monitoring, Europe
- 4.2.3 Inflation Reduction Act Tax-Credit Verification Creating Surge in United States Power-Plant CEMS Retrofits
- 4.2.4 In-Situ Laser-Based Sensors Cutting Lifecycle Cost by 30% in Asia Pacific Waste-to-Energy Plants
- 4.2.5 National Clean Air Programme Accelerating Coal-Fired CEMS Roll-Outs, India
- 4.2.6 IMO 2023 EEXI and CII Rules Triggering Ship-Board SEMS Installations, Global Maritime
- 4.3 Market Restraints
- 4.3.1 Scarcity of TUV and MCERTS-Certified Technicians Delaying European Commissioning
- 4.3.2 High Humidity Bias in Tropical Regions Raising False-Compliance Risk
- 4.3.3 Legacy DCS-DAQ Inter-Operability Gaps Inflating Retrofit Costs in United States Utilities
- 4.3.4 Capital Lock-In From Long-Term CEMS Leasing Models Hindering PEMS Adoption, Middle East
- 4.4 Industry Ecosystem Analysis
- 4.5 Technological Outlook
- 4.6 Impact of Macroeconomic Factors on the Market
- 4.7 Porter's Five Forces Analysis
- 4.7.1 Bargaining Power of Suppliers
- 4.7.2 Bargaining Power of Buyers
- 4.7.3 Threat of New Entrants
- 4.7.4 Threat of Substitutes
- 4.7.5 Intensity of Competitive Rivalry
5 MARKET SIZE AND GROWTH FORECASTS (VALUE)
- 5.1 By System Type
- 5.1.1 Continuous Emission Monitoring Systems (CEMS)
- 5.1.2 Predictive Emission Monitoring Systems (PEMS)
- 5.2 By Component
- 5.2.1 Hardware
- 5.2.1.1 Gas Analyzers
- 5.2.1.2 Flow and Opacity Monitors
- 5.2.1.3 Data Acquisition Systems (DAS)
- 5.2.2 Software
- 5.2.2.1 Stand-Alone
- 5.2.2.2 Cloud-Hosted
- 5.2.3 Services
- 5.2.3.1 Installation and Deployment
- 5.2.3.2 Calibration and Certification
- 5.2.3.3 Support and Maintenance
- 5.2.1 Hardware
- 5.3 By Monitoring Technology
- 5.3.1 Extractive
- 5.3.1.1 Hot-Wet
- 5.3.1.2 Cold-Dry
- 5.3.2 Dilution
- 5.3.3 In-Situ
- 5.3.3.1 Tunable Diode Laser Spectroscopy (TDLS)
- 5.3.1 Extractive
- 5.4 By End-User Industry
- 5.4.1 Power Generation
- 5.4.1.1 Coal-Fired
- 5.4.1.2 Combined-Cycle Gas Turbines
- 5.4.2 Oil and Gas
- 5.4.2.1 Upstream
- 5.4.2.2 Midstream
- 5.4.2.3 Downstream and Refineries
- 5.4.3 Metals and Mining
- 5.4.4 Chemicals and Petrochemicals
- 5.4.5 Pharmaceuticals
- 5.4.6 Cement and Aggregates
- 5.4.7 Pulp and Paper
- 5.4.8 Waste-to-Energy and Incineration
- 5.4.9 Maritime (Ship-Board)
- 5.4.1 Power Generation
- 5.5 By Geography
- 5.5.1 North America
- 5.5.1.1 United States
- 5.5.1.2 Canada
- 5.5.1.3 Mexico
- 5.5.2 South America
- 5.5.2.1 Brazil
- 5.5.2.2 Argentina
- 5.5.2.3 Rest of South America
- 5.5.3 Europe
- 5.5.3.1 United Kingdom
- 5.5.3.2 Germany
- 5.5.3.3 France
- 5.5.3.4 Italy
- 5.5.3.5 Spain
- 5.5.3.6 Russia
- 5.5.3.7 Rest of Europe
- 5.5.4 Asia Pacific
- 5.5.4.1 China
- 5.5.4.2 India
- 5.5.4.3 Japan
- 5.5.4.4 South Korea
- 5.5.4.5 Australia
- 5.5.4.6 Southeast Asia
- 5.5.4.7 Rest of Asia Pacific
- 5.5.5 Middle East
- 5.5.5.1 United Arab Emirates
- 5.5.5.2 Saudi Arabia
- 5.5.5.3 Turkey
- 5.5.5.4 Rest of Middle East
- 5.5.6 Africa
- 5.5.6.1 South Africa
- 5.5.6.2 Nigeria
- 5.5.6.3 Egypt
- 5.5.6.4 Rest of Africa
- 5.5.1 North America
6 COMPETITIVE LANDSCAPE
- 6.1 Market Concentration
- 6.2 Strategic Moves
- 6.3 Market Share Analysis
- 6.4 Company Profiles (includes Global Level Overview, Market Level Overview, Core Segments, Financials as Available, Strategic Information, Market Rank/Share for Key Companies, Products and Services, and Recent Developments)
- 6.4.1 ABB Ltd.
- 6.4.2 Siemens AG
- 6.4.3 Emerson Electric Co.
- 6.4.4 General Electric Company
- 6.4.5 AMETEK Inc.
- 6.4.6 Thermo Fisher Scientific Inc.
- 6.4.7 Honeywell International Inc.
- 6.4.8 Teledyne Technologies Inc.
- 6.4.9 HORIBA Ltd.
- 6.4.10 SICK AG
- 6.4.11 Rockwell Automation Inc.
- 6.4.12 Fuji Electric Co. Ltd.
- 6.4.13 Advanced Emissions Solutions Inc.
- 6.4.14 ENVEA Global SAS
- 6.4.15 Parker Hannifin Corp.
- 6.4.16 Baker Hughes Co.
- 6.4.17 Cemtrex Inc.
- 6.4.18 Babcock and Wilcox Enterprises Inc.
- 6.4.19 Opsis AB
- 6.4.20 Altech Environment U.S.A.
7 MARKET OPPORTUNITIES AND FUTURE OUTLOOK
- 7.1 White-Space and Unmet-Need Assessment

