PUBLISHER: Mordor Intelligence | PRODUCT CODE: 2114569

PUBLISHER: Mordor Intelligence | PRODUCT CODE: 2114569
Ophthalmology Diagnostics - Market Share Analysis, Industry Trends & Statistics, Growth Forecasts (2026 - 2031)
According to Mordor Intelligence, the ophthalmology diagnostics market size is expected to grow from USD 9.02 billion in 2025 to USD 9.47 billion in 2026 and is forecast to reach USD 12.32 billion by 2031 at 5.40% CAGR over 2026-2031.
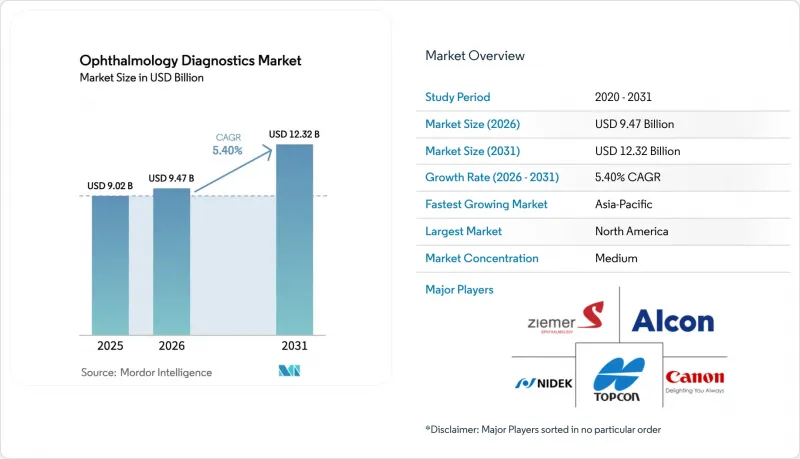
This report is Segmented by Product (Corneal Topographers, and More), Application (Retinal Evaluation, Glaucoma Detection, Surgical Evaluation, Refraction Assessment, and Other Applications), End-User (Hospitals, Specialty Clinics, and Other End-Users), and Geography (North America, Europe, Asia-Pacific, Middle East & Africa, South America). The Market Forecasts are Provided in Terms of Value (USD).
Global Ophthalmology Diagnostics Market Trends and Insights
Rising Incidence of Eye Diseases Due to Aging Population and Diabetes
Diabetic retinopathy now affects 103 million adults worldwide, a 24% rise since 2021, while age-related macular degeneration cases are projected to reach 288 million by 2040: both trends multiply diagnostic workloads. American Diabetes Association guideline revisions in 2025 shortened screening intervals from 24 to 12 months, effectively doubling test frequency. Cataract procedures rebounded to 28 million in 2025, increasing demand for biometry and corneal topography equipment. India budgeted INR 12 billion (USD 144 million) to equip 3,000 primary centers with fundus cameras and autorefractors, illustrating government pull-through. The ophthalmology workforce deficit of 1 specialist per 17,000 population amplifies the imperative for automated diagnostics.
Growing Adoption of OCT and AI-Integrated Imaging Modalities
Swept-source OCT shipments expanded 18% year-over-year in 2025, fueled by deeper penetration and faster scan speeds that improve visualization of choroidal layers. Seven AI diagnostic algorithms earned U.S. FDA De Novo or 510(k) clearances between 2024 and 2025, including Notal Vision's home-use OCT system, evidencing regulatory momentum. Cloud services, such as EyePACS, processed 1.2 million images in 2025, returning 92% of expected results within 24 hours and reducing unnecessary referrals. Reimbursement gaps outside the United States persist, with only four EU nations covering autonomous diabetic retinopathy screening as of 2025. IT integration costs per hospital run USD 50,000-150,000, tempering implementation velocity.
High Capital Cost of Advanced Imaging Systems
Swept-source OCT units list at USD 120,000-180,000, which exceeds the capital expenditure (cap-ex) envelope of many stand-alone practices whose annual equipment budgets typically sit below USD 200,000. Ultra-widefield cameras cost USD 80,000-150,000 and require 800-1,200 studies per year for a three-year payback at Medicare tariff levels. Leasing carries an interest rate of 6-8%, adding USD 15,000-25,000 to the cost of five-year ownership. Import tariffs of 15-30% inflate device prices in India, Brazil, and South Africa, while interest rates exceed 12%. National tenders move slowly; India delivered only 2,100 of 5,000 ordered cameras by December 2025 due to procurement delays.
Other drivers and restraints analyzed in the detailed report include:
- Favorable Government Programs for Vision Care
- Embedding Ophthalmic Diagnostics into Point-of-Care Primary Clinics via Handheld Devices
- Shortage of Skilled Ophthalmologists and Technicians
For complete list of drivers and restraints, kindly check the Table Of Contents.
Segment Analysis
OCT scanners generated 38.45% of the revenue in 2025, underscoring their dominance in retina and glaucoma imaging, while fundus cameras posted the fastest 7.58% CAGR from 2026 to 2031. The Ophthalmology Diagnostics market size for fundus cameras is projected to expand as primary care practices deploy ultra-widefield devices under CPT code 92229 reimbursement. Ultra-widefield platforms capture 200-degree views in a single shot, easing exams in pediatric and cognitively challenged cohorts. Corneal-topography systems priced at USD 40,000-60,000 are gaining ground in refractive planning, although adoption tends to skew toward high-volume laser centers. Digital replacements are outpacing handheld ophthalmoscopes priced below USD 1,000; Welch Allyn reported a 12%-unit decline in 2025. Swept-source OCT, led by Topcon Triton and Zeiss PLEX Elite, captured 60% of 2025 installations by offering 100,000 A-scans per second, compared to 70,000 for spectral-domain peers, thereby trimming scan times and enhancing choroidal visualization. Regulatory hurdles are moderate; most systems can be cleared under FDA 510(k) pathways, allowing for 12-18-month development cycles.
Fundus-camera growth outpaces other categories because unit prices (USD 15,000-80,000) align with primary-care budgets. Ultra-widefield imaging enables referral-quality screening without dilation, and AI integration facilitates automated triage, reducing specialist workload by 70%. Camera makers now bundle software-as-a-service, shifting costs from capital expenditure to operating expenditure. Competitive gaps persist: smartphone attachments match 94% diagnostic concordance yet still face partial reimbursement. The product mix is expanding to include multimodal devices that combine OCT, OCT-A, and fundus photography, as evident in Heidelberg Engineering's Spectralis platform, which captured 35% of European tertiary-center spend in 2025.
Complete Report Scope:
- By Product
- Corneal Topographers
- Fundus Cameras
- Ophthalmoscopes
- OCT Scanners
- Retinoscopes
- Refractors
- Other Products
- By Application
- Retinal Evaluation
- Glaucoma Detection
- Surgical Evaluation
- Refraction Assessment
- Other Applications
- By End-User
- Hospitals
- Specialty Clinics
- Other End-Users
- Geography
- North America
- United States
- Canada
- Mexico
- Europe
- Germany
- United Kingdom
- France
- Italy
- Spain
- Rest of Europe
- Asia-Pacific
- China
- Japan
- India
- Australia
- South Korea
- Rest of Asia-Pacific
- Middle East & Africa
- GCC
- South Africa
- Rest of Middle East & Africa
- South America
- Brazil
- Argentina
- Rest of South America
- North America
Geography Analysis
North America generated 41.87% of the revenue in 2025, anchored by CPT 92229 reimbursement, which spiked primary-care screens by 40% in the first year. Ophthalmologist saturation in urban areas, combined with negotiated rate cuts of 8-12% by Medicare Advantage plans, tempers growth. Private-equity consolidation now covers 60% of U.S. practices with five or more physicians, aggregating purchasing leverage and reducing equipment prices by 15-25%. Canada lags in advanced imaging; only four provinces reimburse OCT-angiography for diabetic macular edema.
Asia-Pacific is poised for a 6.43% CAGR, the swiftest regional climb, with India scaling tele-ophthalmology to 500 districts by 2027 and China mandating annual exams for seniors under Healthy China 2030. India added 2,100 fundus cameras in 2025, yet still reaches only 15% of its primary-care targets. Japan's myopia prevalence (40% of adults) drives swept-source OCT adoption, now 55% of new installations. Domestic Chinese vendors priced 40% below multinationals, winning a 22% share of the fundus-camera market, although false-negative rates are 8% higher in validation studies.
Europe contributed 28% of 2025 revenue but faces GDPR-driven cloud hesitancy, which is pushing 40% of practices toward on-premise data stores and increasing IT spend. Germany and France reimburse OCT-angiography nationally; however, southern markets struggle with budget limits. The United Kingdom's NHS placed 180 OCTs in community optometry sites, cutting glaucoma referral wait times from 12 to 3 weeks.
The Middle East & Africa posted 5.8% growth, driven by Saudi Vision 2030 funding for 47 vision centers in 2025. Sub-Saharan Africa still supports only 1 ophthalmologist per 250,000 people; smartphone-based screening by Peek Vision covered 400,000 patients in 2025. South America advanced 5.2%; Brazil tendered 1,200 cameras, but import tariffs and delivery delays curbed deployment.
- Alcon
- Bausch + Lomb Corporation
- Canon
- Carl Zeiss
- Coburn Technologies
- EssilorLuxottica
- HAAG-Streit
- Heidelberg Engineering
- Johnson & Johnson
- Lumenis
- Lumibird Group SA
- Marco Ophthalmic
- Metall Zug Group (Haag-Streit Holding)
- Nidek
- Optos plc (Nikon Corporation)
- Optovue Inc. (Visionix)
- Quantel Medical (Lumibird)
- Topcon
- Visionix Ltd.
- Ziemer Group
Additional Benefits:
- The market estimate (ME) sheet in Excel format
- 3 months of analyst support
TABLE OF CONTENTS
1 Introduction
- 1.1 Study Assumptions & Market Definition
- 1.2 Scope of the Study
2 Research Methodology
3 Executive Summary
4 Market Landscape
- 4.1 Market Overview
- 4.2 Market Drivers
- 4.2.1 Rising Incidence of Eye Diseases due to Aging Population and Diabetes
- 4.2.2 Growing Adoption of OCT and AI-Integrated Imaging Modalities
- 4.2.3 Favorable Government Programs for Vision Care
- 4.2.4 Embedding Ophthalmic Diagnostics into Point-of-Care Primary Clinics via Compact Handheld Devices
- 4.2.5 Integration of Teleophthalmology Platforms with Cloud-Based Diagnostic Analytics
- 4.3 Market Restraints
- 4.3.1 High Capital Cost of Advanced Imaging Systems
- 4.3.2 Shortage of Skilled Ophthalmologists and Technicians
- 4.3.3 Data Privacy Concerns Hindering Cloud Deployment of Diagnostic Images
- 4.4 Value / Supply-Chain Analysis
- 4.5 Regulatory Landscape
- 4.6 Technological Outlook
- 4.7 Porter's Five Forces Analysis
- 4.7.1 Bargaining Power Of Suppliers
- 4.7.2 Bargaining Power Of Buyers/Consumers
- 4.7.3 Threat Of New Entrants
- 4.7.4 Threat Of Substitute Products
- 4.7.5 Intensity Of Competitive Rivalry
5 Market Size & Growth Forecasts (Value, USD)
- 5.1 By Product
- 5.1.1 Corneal Topographers
- 5.1.2 Fundus Cameras
- 5.1.3 Ophthalmoscopes
- 5.1.4 OCT Scanners
- 5.1.5 Retinoscopes
- 5.1.6 Refractors
- 5.1.7 Other Products
- 5.2 By Application
- 5.2.1 Retinal Evaluation
- 5.2.2 Glaucoma Detection
- 5.2.3 Surgical Evaluation
- 5.2.4 Refraction Assessment
- 5.2.5 Other Applications
- 5.3 By End-User
- 5.3.1 Hospitals
- 5.3.2 Specialty Clinics
- 5.3.3 Other End-Users
- 5.4 Geography
- 5.4.1 North America
- 5.4.1.1 United States
- 5.4.1.2 Canada
- 5.4.1.3 Mexico
- 5.4.2 Europe
- 5.4.2.1 Germany
- 5.4.2.2 United Kingdom
- 5.4.2.3 France
- 5.4.2.4 Italy
- 5.4.2.5 Spain
- 5.4.2.6 Rest of Europe
- 5.4.3 Asia-Pacific
- 5.4.3.1 China
- 5.4.3.2 Japan
- 5.4.3.3 India
- 5.4.3.4 Australia
- 5.4.3.5 South Korea
- 5.4.3.6 Rest of Asia-Pacific
- 5.4.4 Middle East & Africa
- 5.4.4.1 GCC
- 5.4.4.2 South Africa
- 5.4.4.3 Rest of Middle East & Africa
- 5.4.5 South America
- 5.4.5.1 Brazil
- 5.4.5.2 Argentina
- 5.4.5.3 Rest of South America
- 5.4.1 North America
6 Competitive Landscape
- 6.1 Market Concentration
- 6.2 Market Share Analysis
- 6.3 Company Profiles (includes Global level Overview, Market level overview, Core Segments, Financials as available, Strategic Information, Market Rank/Share, Products & Services, Recent Developments)
- 6.3.1 Alcon Inc.
- 6.3.2 Bausch + Lomb Corporation
- 6.3.3 Canon Inc.
- 6.3.4 Carl Zeiss Meditec AG
- 6.3.5 Coburn Technologies Inc.
- 6.3.6 EssilorLuxottica SA
- 6.3.7 Haag-Streit Group
- 6.3.8 Heidelberg Engineering GmbH
- 6.3.9 Johnson & Johnson Vision
- 6.3.10 Lumenis Ltd.
- 6.3.11 Lumibird Group SA
- 6.3.12 Marco Ophthalmic Inc.
- 6.3.13 Metall Zug Group (Haag-Streit Holding)
- 6.3.14 NIDEK Co., Ltd.
- 6.3.15 Optos plc (Nikon Corporation)
- 6.3.16 Optovue Inc. (Visionix)
- 6.3.17 Quantel Medical (Lumibird)
- 6.3.18 Topcon Corporation
- 6.3.19 Visionix Ltd.
- 6.3.20 Ziemer Ophthalmic Systems AG
7 Market Opportunities & Future Outlook
- 7.1 White-Space & Unmet-Need Assessment

