PUBLISHER: Mordor Intelligence | PRODUCT CODE: 2114672

PUBLISHER: Mordor Intelligence | PRODUCT CODE: 2114672
Rare Neurological Disease Treatment - Market Share Analysis, Industry Trends & Statistics, Growth Forecasts (2026 - 2031)
According to Mordor Intelligence, the rare neurological disease treatment market size is expected to grow from USD 15.72 billion in 2025 to USD 16.77 billion in 2026 and is forecast to reach USD 23.15 billion by 2031 at 6.66% CAGR over 2026-2031.
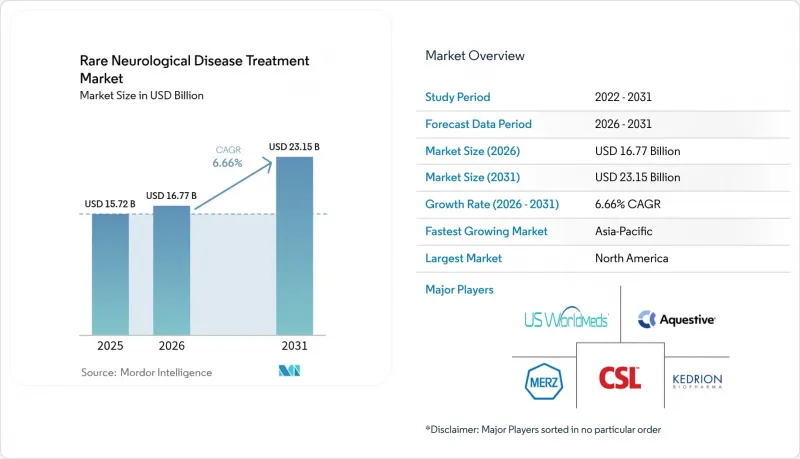
This report is Segmented by Therapy Type (Small-Molecule Drugs, Biologics & Monoclonal Antibodies, Gene Therapy, Enzyme-Replacement Therapy, and More), Indication (Spinal Muscular Atrophy, Duchenne Muscular Dystrophy, and More), Route of Administration (Oral, Intravenous, Others), and Geography (North America, Europe, and More). The Market Forecasts are Provided in Terms of Value (USD).
Global Rare Neurological Disease Treatment Market Trends and Insights
FDA Fast-Track & Orphan-Drug Incentives Boosting R&D Investment
The FDA Rare Disease Innovation Hub now assigns specialist reviewers who move dossiers through priority cycles that shorten standard timelines. Breakthrough therapy designations for rare neurological conditions rose 34% year-over-year after 2024, with approvals such as UniQure's AMT-130 and PTC Therapeutics' PTC518 setting precedents for Huntington's disease. Seven-year market exclusivity, fee waivers, and tax credits make the economics attractive even for niche indications, inviting small biotechs into a space once ruled by large pharma. Validation of one program often unlocks broader platform applications, creating virtuous funding loops that keep the rare neurological disease treatment market momentum intact. Accelerated pathways also encourage smarter trial designs that accept surrogate endpoints, enabling developers to pivot resources early.
Rising Prevalence of Rare Neurological Disorders Due to Improved Diagnostics
Universal newborn screening for spinal muscular atrophy in all U.S. states now pinpoints affected infants before symptom onset, transforming lifetime outcomes with early Zolgensma or Spinraza dosing. Costs of whole-genome sequencing have plummeted 99.9% since 2001, bringing advanced diagnostics to community hospitals. Tele-genetics and virtual counseling extend expert oversight to underserved areas, while cloud-based variant libraries increase detection of ultra-rare CNS mutations. Enhanced prevalence data provides a sturdier commercial rationale that fuels additional R&D. Asia-Pacific gains materially as government-funded sequencing panels reach rural populations, broadening the global base for the rare neurological disease treatment market.
High Cost of Biologics and Gene Therapies Limiting Affordability
Average annual therapy spend for rare diseases hit USD 32,000 in 2024, and top-end gene therapies such as Zolgensma list at USD 2.1 million. Payers respond with prior-authorization layers, outcome-based deals, and installment contracts that slow rollout. In middle-income settings, fiscal ceilings effectively ration access, creating a bifurcated global landscape unseen in mass-market therapies. Manufacturers are experimenting with annuity-style arrangements, but the administrative burden often outweighs benefits for smaller health systems.
Other drivers and restraints analyzed in the detailed report include:
- Venture-Capital Funding Surge for Gene & RNA Therapies
- Increasing Newborn-Screening Programs for SMA & Others
- Clinical-Trial Recruitment Challenges Due to Ultra-Small Patient Pools
For complete list of drivers and restraints, kindly check the Table Of Contents.
Segment Analysis
Gene therapy contributed 35.78% to 2025 revenue, underpinned by blockbuster launches and label extensions of AAV-based constructs. The rare neurological disease market size tied to gene therapy will grow at 6.05% annually through 2031 as next-generation vectors tackle larger genes and re-dosing obstacles. RNA-based therapy records the swiftest climb at 7.12% CAGR, reflecting investor appetite for antisense and siRNA platforms that reuse chemistry across indications. Small-molecule programs keep residual share where blood-brain barrier penetration remains feasible, and monoclonal antibodies advance alongside improved CNS delivery systems. Enzyme-replacement therapy stabilizes as a workhorse for lysosomal storage disorders.
Pipeline activity highlights how platform reuse lowers per-asset cost. Spinraza, Eteplirsen, Vutrisiran, and Eplontersen illustrate that one delivery backbone can support diverse targets, a dynamic that intensifies competitive pressure across therapy classes. As price scrutiny mounts, developers tout manufacturing scalability and rapid tech-transfer as differentiators. This competition fosters a richer portfolio of launch candidates, reinforcing the long-term trajectory of the rare neurological disease treatment market.
Complete Report Scope:
- By Therapy Type (Value)
- Small-Molecule Drugs
- Biologics & Monoclonal Antibodies
- Gene Therapy
- Enzyme-Replacement Therapy
- RNA-based Therapy
- Others
- By Indication (Value)
- Spinal Muscular Atrophy
- Duchenne Muscular Dystrophy
- Batten Disease
- Amyotrophic Lateral Sclerosis (Rare Forms)
- Huntington's Disease
- Rare Epilepsy Syndromes
- Others
- By Route of Administration (Value)
- Oral
- Intravenous
- Others
- By Geography (Value)
- North America
- United States
- Canada
- Mexico
- Europe
- Germany
- United Kingdom
- France
- Italy
- Spain
- Rest of Europe
- Asia-Pacific
- China
- India
- Japan
- South Korea
- Australia
- Rest of Asia-Pacific
- South America
- Brazil
- Argentina
- Rest of South America
- Middle East and Africa
- GCC
- South Africa
- Rest of Middle East and Africa
- North America
Geography Analysis
North America generated 41.72% of global sales in 2025 on the back of specialized clinics, integrated payer systems, and the FDA's orphan-friendly stance. The region's multiplier effect-where rapid regulatory approval feeds early reimbursement and guideline adoption-creates a cyclical advantage that entrenches its leadership. Yet price negotiations intensify under the Inflation Reduction Act, prompting manufacturers to weigh net-price erosion against early-launch benefits.
Europe occupies the second-largest share with its centralized EMA approval route but fragmented reimbursement labyrinth. Health-technology assessments in Germany, France, and the United Kingdom scrutinize cost-effectiveness of seven-figure therapies, occasionally imposing risk-share deals that delay full market entry. Nonetheless, Europe's academic depth fuels investigator-sponsored trials that enrich global evidence bases, particularly in gene-therapy translational research.
Asia-Pacific is the rare neurological disease treatment market's fastest climber at a 9.58% CAGR, benefitting from Japan's SAKIGAKE, China's breakthrough therapy designation, and Australia's expedited schemes. National rare-disease catalogs unlock early access funding, while high population density magnifies absolute patient counts despite low prevalence. Cold-chain logistics and affordability remain hurdles, but regional collaborations-exemplified by South Korea's rare-disease registry network-are narrowing the infrastructure gap.
- Biogen
- Roche
- Novartis
- Pfizer
- Sarepta Therapeutics
- Ionis Pharmaceuticals
- UCB
- Argenx SE
- Reata Pharmaceuticals, Inc.
- Sanofi
- AstraZeneca
- Biomarin Pharmaceutical
- Jazz Pharmaceuticals plc
- Ultragenyx Pharmaceutical Inc.
- PTC Therapeutics, Inc.
- CSL Behring
- Ipsen
- Mitsubishi Tanabe Pharma Corp.
- Marinus Pharmaceuticals, Inc.
- Catalyst Pharmaceuticals, Inc.
Additional Benefits:
- The market estimate (ME) sheet in Excel format
- 3 months of analyst support
TABLE OF CONTENTS
1 Introduction
- 1.1 Study Assumptions & Market Definition
- 1.2 Scope of the Study
2 Research Methodology
3 Executive Summary
4 Market Landscape
- 4.1 Market Overview
- 4.2 Market Drivers
- 4.2.1 FDA fast-track & orphan-drug incentives boosting R&D investment
- 4.2.2 Rising prevalence of rare neurological disorders due to improved diagnostics
- 4.2.3 Venture-capital funding surge for gene & RNA therapies targeting rare CNS diseases
- 4.2.4 Increasing newborn-screening programs for spinal muscular atrophy & others
- 4.2.5 AI-powered drug-repurposing platforms identifying CNS orphan indications
- 4.2.6 Cross-border patient-advocacy consortiums accelerating compassionate-use access
- 4.3 Market Restraints
- 4.3.1 High cost of biologics and gene therapies limiting affordability
- 4.3.2 Clinical-trial recruitment challenges due to ultra-small patient pools
- 4.3.3 Stringent CNS safety requirements prolonging regulatory approval timelines
- 4.3.4 Cold-chain logistics gaps for intrathecal RNA drugs in emerging markets
- 4.4 Value / Supply-Chain Analysis
- 4.5 Regulatory Landscape
- 4.6 Technological Outlook
- 4.7 Porter's Five Forces
- 4.7.1 Bargaining Power of Buyers
- 4.7.2 Bargaining Power of Suppliers
- 4.7.3 Threat of New Entrants
- 4.7.4 Threat of Substitutes
- 4.7.5 Degree of Competition
5 Market Size & Growth Forecasts
- 5.1 By Therapy Type (Value)
- 5.1.1 Small-Molecule Drugs
- 5.1.2 Biologics & Monoclonal Antibodies
- 5.1.3 Gene Therapy
- 5.1.4 Enzyme-Replacement Therapy
- 5.1.5 RNA-based Therapy
- 5.1.6 Others
- 5.2 By Indication (Value)
- 5.2.1 Spinal Muscular Atrophy
- 5.2.2 Duchenne Muscular Dystrophy
- 5.2.3 Batten Disease
- 5.2.4 Amyotrophic Lateral Sclerosis (Rare Forms)
- 5.2.5 Huntington's Disease
- 5.2.6 Rare Epilepsy Syndromes
- 5.2.7 Others
- 5.3 By Route of Administration (Value)
- 5.3.1 Oral
- 5.3.2 Intravenous
- 5.3.3 Others
- 5.4 By Geography (Value)
- 5.4.1 North America
- 5.4.1.1 United States
- 5.4.1.2 Canada
- 5.4.1.3 Mexico
- 5.4.2 Europe
- 5.4.2.1 Germany
- 5.4.2.2 United Kingdom
- 5.4.2.3 France
- 5.4.2.4 Italy
- 5.4.2.5 Spain
- 5.4.2.6 Rest of Europe
- 5.4.3 Asia-Pacific
- 5.4.3.1 China
- 5.4.3.2 India
- 5.4.3.3 Japan
- 5.4.3.4 South Korea
- 5.4.3.5 Australia
- 5.4.3.6 Rest of Asia-Pacific
- 5.4.4 South America
- 5.4.4.1 Brazil
- 5.4.4.2 Argentina
- 5.4.4.3 Rest of South America
- 5.4.5 Middle East and Africa
- 5.4.5.1 GCC
- 5.4.5.2 South Africa
- 5.4.5.3 Rest of Middle East and Africa
- 5.4.1 North America
6 Competitive Landscape
- 6.1 Market Concentration
- 6.2 Market Share Analysis
- 6.3 Company Profiles {(includes Global level Overview, Market level overview, Core Segments, Financials as available, Strategic Information, Market Rank/Share for key companies, Products & Services, and Recent Developments)}
- 6.3.1 Biogen Inc.
- 6.3.2 Roche Holding AG
- 6.3.3 Novartis AG
- 6.3.4 Pfizer Inc.
- 6.3.5 Sarepta Therapeutics, Inc.
- 6.3.6 Ionis Pharmaceuticals, Inc.
- 6.3.7 UCB S.A.
- 6.3.8 Argenx SE
- 6.3.9 Reata Pharmaceuticals, Inc.
- 6.3.10 Sanofi S.A.
- 6.3.11 AstraZeneca PLC
- 6.3.12 BioMarin Pharmaceutical Inc.
- 6.3.13 Jazz Pharmaceuticals plc
- 6.3.14 Ultragenyx Pharmaceutical Inc.
- 6.3.15 PTC Therapeutics, Inc.
- 6.3.16 CSL Limited
- 6.3.17 Ipsen S.A.
- 6.3.18 Mitsubishi Tanabe Pharma Corp.
- 6.3.19 Marinus Pharmaceuticals, Inc.
- 6.3.20 Catalyst Pharmaceuticals, Inc.
7 Market Opportunities & Future Outlook
- 7.1 White-space & Unmet-Need Assessment

