PUBLISHER: Mordor Intelligence | PRODUCT CODE: 2115159

PUBLISHER: Mordor Intelligence | PRODUCT CODE: 2115159
US Customs Brokerage - Market Share Analysis, Industry Trends & Statistics, Growth Forecasts (2026 - 2031)
According to Mordor Intelligence, the US customs brokerage market size is estimated at USD 5.48 billion in 2026, and is expected to reach USD 6.31 billion by 2031, at a CAGR of 2.88% during the forecast period (2026-2031).
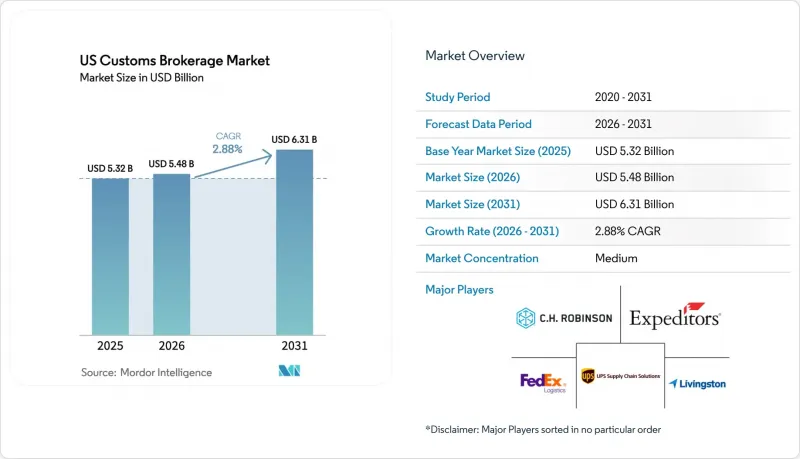
This report is Segmented by Mode of Transport (Ocean / Sea, Air, and More), by Broker Type (Pure Customs Brokers and More), by Importer Size (Large Enterprises and More), by Digital Adoption (Traditional Brokerages and More), by End-Use Industry (Retail and E-Commerce and More), by Region (West, Southwest, and More). The Market Forecasts are Provided in Terms of Value (USD).
US Customs Brokerage Market Trends and Insights
Digitization and Automation of Customs Processes
Automated Commercial Environment adoption stands at 98%, handling above 35 million formal entries annually. Integration with partner agencies has compressed clearance cycles from days to hours. Leading brokers deploy machine-learning classification tools that achieve more than 95% code-assignment accuracy, cutting manual touchpoints and freeing staff for advisory work. CBP's 2024-2028 IT roadmap earmarks USD 1.8 billion for blockchain pilots and AI-based risk scoring, further raising the technology bar for market participants.
Rise of E-commerce Micro-Importers Requiring High-Frequency Clearances
More than 400,000 US businesses imported goods in 2025, up 60% since 2019, with micro-importers representing 38% of the total. Digital brokers have responded with self-service portals and flat-fee models that appeal to entrepreneurs seeking transparent pricing. Platforms such as Amazon Global Logistics streamline cross-border fulfillment, yet many small shippers misclassify goods or overlook labeling rules, amplifying compliance risk. Brokers balancing automation with proactive education win loyalty in this dispersed client base.
Shortage of Licensed Customs Brokers Driving Wage Inflation
The October 2025 Customs Broker License Exam posted a sub-15% pass rate, while the average broker age exceeds 43 years. Mid-level licensed professionals now command salaries 20-30% higher than 2022 levels. Smaller firms without automation budgets face service constraints as veteran staff retire.
Other drivers and restraints analyzed in the detailed report include:
- Monetization of ACE Data into Value-Added Analytics Services
- CBP "21st Century Customs Framework" Unlocking New Broker Roles
- Expansion of DIY Self-Filing Software Eroding Fee Margins
For complete list of drivers and restraints, kindly check the Table Of Contents.
Segment Analysis
Ocean freight held 58.63% of the United States customs brokerage market share in 2025 as importers favored cost-efficient containerized shipping. The United States customs brokerage market size tied to air cargo is projected to grow at a 4.09% CAGR through 2031 as e-commerce and time-sensitive industries prioritize speed. Express integrators leverage integrated clearance to shorten cycle times, while land-border truck and rail entries gain ground in the Southwest corridor.
Container reliability improvements following pandemic disruption have reinforced the ocean's cost advantage, yet recurring labor actions and slot allocation constraints spur some shippers to shift high-value goods to air despite the premium freight cost. Brokers with multi-modal expertise are best positioned to capture clients that balance speed and cost across seasonal demand cycles.
Forwarder-linked and 3PL-integrated operators controlled a 65.46% share in 2025, reflecting shippers' preference for single-invoice logistics solutions that bundle clearance, carriage, and warehousing. Pure customs brokers grew at a 3.51% CAGR as complex verticals such as FDA-regulated goods and foreign-trade-zone operations demanded specialized knowledge.
The acquisition of Livingston International by Purolator for USD 684.4 million in February 2025 underlines consolidation momentum as integrated operators seek deep compliance capabilities. Niche brokers respond by doubling down on vertical intelligence and personalized service that larger networks struggle to replicate.
Complete Report Scope:
- By Service Type
- Customs Clearance
- Trade Compliance Advisory
- Duty Drawback & Refund Services
- Freight Forwarding-Linked Brokerage
- By Mode of Transport
- Ocean
- Air
- Truck
- Rail
- By End-user Industry
- Consumer Goods & Retail
- Automotive
- Electronics & Hi-Tech
- Agriculture & Food
- Pharmaceuticals & Healthcare
- By Client Size
- Enterprise Importers (more than $50 M annual imports)
- Mid-market Importers ($5-50 M)
- Small & Micro Importers (less than $5 M)
- By Geography
- Northeast
- Midwest
- Southeast
- Southwest
- West
List of Companies Covered in this Report:
- Expeditors International of Washington, Inc.
- C.H. Robinson Worldwide, Inc.
- UPS Supply Chain Solutions
- FedEx Logistics
- Livingston International (acquired by Purolator)
- DHL Global Forwarding
- Kuehne + Nagel Inc.
- DSV (incl. DB Schenker)
- A.N. Deringer, Inc.
- Flexport, Inc.
- CEVA Logistics (Acquired by CMA CGM)
- OEC Group
- BDP International
- SEKO Logistics
- Kerry Logistics (USA)
- Nippon Express
- GEODIS USA
- C.H. Powell Co.
- Alba Wheels Up International
- GHY USA Inc.
Additional Benefits:
- The market estimate (ME) sheet in Excel format
- 3 months of analyst support
TABLE OF CONTENTS
1 Introduction
- 1.1 Study Assumptions & Market Definition Scope of the Study
2 Research Methodology
3 Executive Summary
4 Market Landscape
- 4.1 Market Overview
- 4.2 Market Drivers
- 4.2.1 Growth in U.S. import volumes rebounding post-pandemic
- 4.2.2 Complexity stemming from shifting tariff & trade-agreement rules
- 4.2.3 Digitization & automation of customs processes (ACE, PGA portals)
- 4.2.4 Rise of e-commerce micro-importers requiring high-frequency clearances
- 4.2.5 Monetization of ACE data into value-added analytics services
- 4.2.6 CBP "21st Century Customs Framework" unlocking new broker value-added roles
- 4.3 Market Restraints
- 4.3.1 Heightened trade-policy volatility creating forecasting risk
- 4.3.2 Rising compliance costs for forced-labor & ESG documentation
- 4.3.3 Shortage of licensed customs brokers driving wage inflation
- 4.3.4 Expansion of DIY self-filing software eroding broker fee margins
- 4.4 Value / Supply-Chain Analysis
- 4.5 Regulatory Landscape
- 4.6 Technological Outlook
- 4.7 Porter's Five Forces
- 4.7.1 Threat of New Entrants
- 4.7.2 Bargaining Power of Buyers
- 4.7.3 Bargaining Power of Suppliers
- 4.7.4 Threat of Substitutes
- 4.7.5 Competitive Rivalry
5 Market Size & Growth Forecasts (Value, USD)
- 5.1 By Service Type
- 5.1.1 Customs Clearance
- 5.1.2 Trade Compliance Advisory
- 5.1.3 Duty Drawback & Refund Services
- 5.1.4 Freight Forwarding-Linked Brokerage
- 5.2 By Mode of Transport
- 5.2.1 Ocean
- 5.2.2 Air
- 5.2.3 Truck
- 5.2.4 Rail
- 5.3 By End-user Industry
- 5.3.1 Consumer Goods & Retail
- 5.3.2 Automotive
- 5.3.3 Electronics & Hi-Tech
- 5.3.4 Agriculture & Food
- 5.3.5 Pharmaceuticals & Healthcare
- 5.4 By Client Size
- 5.4.1 Enterprise Importers (more than $50 M annual imports)
- 5.4.2 Mid-market Importers ($5-50 M)
- 5.4.3 Small & Micro Importers (less than $5 M)
- 5.5 By Geography
- 5.5.1 Northeast
- 5.5.2 Midwest
- 5.5.3 Southeast
- 5.5.4 Southwest
- 5.5.5 West
6 Competitive Landscape
- 6.1 Market Concentration
- 6.2 Strategic Moves
- 6.3 Market Share Analysis
- 6.4 Company Profiles (includes Global level Overview, Market level overview, Core Segments, Financials as available, Strategic Information, Market Rank/Share for key companies, Products & Services, and Recent Developments)
- 6.4.1 Expeditors International of Washington, Inc.
- 6.4.2 C.H. Robinson Worldwide, Inc.
- 6.4.3 UPS Supply Chain Solutions
- 6.4.4 FedEx Logistics
- 6.4.5 Livingston International (acquired by Purolator)
- 6.4.6 DHL Global Forwarding
- 6.4.7 Kuehne + Nagel Inc.
- 6.4.8 DSV (incl. DB Schenker)
- 6.4.9 A.N. Deringer, Inc.
- 6.4.10 Flexport, Inc.
- 6.4.11 CEVA Logistics (Acquired by CMA CGM)
- 6.4.12 OEC Group
- 6.4.13 BDP International
- 6.4.14 SEKO Logistics
- 6.4.15 Kerry Logistics (USA)
- 6.4.16 Nippon Express
- 6.4.17 GEODIS USA
- 6.4.18 C.H. Powell Co.
- 6.4.19 Alba Wheels Up International
- 6.4.20 GHY USA Inc.
7 Market Opportunities & Future Outlook

